|
Download Data (XLS File) |
|
||||||||
|
||||||||
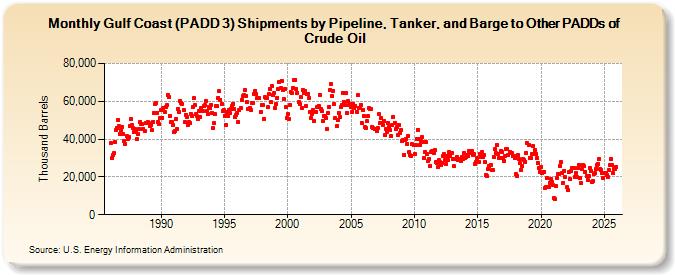
| Gulf Coast (PADD 3) Shipments by Pipeline, Tanker, and Barge to Other PADDs of Crude Oil (Thousand Barrels) | ||||||||
| Year | Jan | Feb | Mar | Apr | May | Jun | Jul | Aug | Sep | Oct | Nov | Dec |
|---|---|---|---|---|---|---|---|---|---|---|---|---|
| 1986 | 37,695 | 29,811 | 31,440 | 32,465 | 38,646 | 44,900 | 45,880 | 50,309 | 46,682 | 42,757 | 45,039 | 46,453 |
| 1987 | 42,570 | 38,877 | 37,648 | 41,588 | 40,283 | 41,144 | 46,808 | 50,552 | 47,208 | 45,673 | 43,698 | 45,472 |
| 1988 | 43,829 | 39,884 | 42,671 | 45,593 | 49,175 | 48,170 | 47,978 | 45,329 | 44,079 | 48,498 | 48,493 | 49,119 |
| 1989 | 48,261 | 46,733 | 47,674 | 44,726 | 49,206 | 53,838 | 58,323 | 59,152 | 54,039 | 49,212 | 47,726 | 51,327 |
| 1990 | 55,364 | 51,357 | 56,527 | 54,456 | 56,972 | 57,930 | 63,366 | 62,077 | 52,482 | 48,793 | 49,065 | 47,613 |
| 1991 | 43,678 | 44,084 | 50,501 | 45,348 | 56,049 | 54,078 | 60,272 | 58,957 | 58,482 | 55,517 | 49,032 | 52,947 |
| 1992 | 51,619 | 47,589 | 49,005 | 48,707 | 53,428 | 52,399 | 57,095 | 61,563 | 57,806 | 53,425 | 52,026 | 50,794 |
| 1993 | 55,009 | 51,679 | 56,460 | 54,690 | 57,294 | 58,240 | 60,139 | 55,002 | 53,301 | 57,061 | 56,335 | 58,286 |
| 1994 | 53,970 | 45,842 | 48,418 | 53,271 | 57,654 | 57,374 | 61,991 | 65,299 | 60,872 | 58,596 | 54,612 | 55,639 |
| 1995 | 52,462 | 47,362 | 54,191 | 52,322 | 55,415 | 53,632 | 56,061 | 57,751 | 58,815 | 55,935 | 51,636 | 52,945 |
| 1996 | 54,030 | 49,087 | 55,428 | 56,480 | 60,731 | 62,541 | 63,351 | 65,748 | 62,721 | 59,566 | 55,980 | 55,988 |
| 1997 | 56,397 | 55,554 | 59,003 | 59,312 | 63,792 | 65,620 | 63,674 | 61,769 | 61,699 | 61,865 | 54,503 | 57,918 |
| 1998 | 58,118 | 50,502 | 62,015 | 61,529 | 61,551 | 56,729 | 63,629 | 66,497 | 59,504 | 68,338 | 63,233 | 64,576 |
| 1999 | 56,453 | 58,523 | 61,990 | 66,741 | 70,332 | 66,795 | 70,980 | 66,202 | 61,450 | 66,458 | 56,757 | 51,067 |
| 2000 | 53,135 | 50,641 | 58,158 | 64,682 | 64,449 | 67,079 | 71,187 | 71,416 | 66,278 | 64,515 | 59,423 | 58,820 |
| 2001 | 62,214 | 56,495 | 65,996 | 64,595 | 65,206 | 57,478 | 63,828 | 64,111 | 61,966 | 54,351 | 51,126 | 53,077 |
| 2002 | 55,228 | 49,377 | 54,186 | 54,278 | 56,739 | 57,771 | 63,558 | 55,740 | 54,637 | 49,640 | 52,338 | 51,957 |
| 2003 | 51,312 | 45,426 | 53,949 | 57,128 | 66,095 | 68,885 | 62,784 | 65,693 | 58,403 | 51,049 | 46,709 | 49,951 |
| 2004 | 53,962 | 51,791 | 56,926 | 57,981 | 64,424 | 59,817 | 58,059 | 64,297 | 53,961 | 59,897 | 58,287 | 58,767 |
| 2005 | 57,213 | 54,534 | 58,708 | 56,302 | 57,632 | 54,559 | 63,167 | 56,648 | 56,325 | 58,085 | 48,676 | 55,295 |
| 2006 | 52,374 | 46,357 | 46,095 | 49,337 | 52,022 | 56,392 | 55,737 | 55,866 | 46,548 | 45,672 | 45,145 | 45,497 |
| 2007 | 44,281 | 45,928 | 53,123 | 48,283 | 51,035 | 48,527 | 47,545 | 49,804 | 42,351 | 45,131 | 43,804 | 48,530 |
| 2008 | 46,388 | 44,745 | 41,599 | 47,240 | 51,814 | 48,726 | 45,297 | 46,250 | 41,966 | 47,511 | 42,983 | 44,558 |
| 2009 | 39,028 | 39,261 | 31,839 | 39,605 | 40,050 | 37,482 | 41,743 | 33,167 | 31,346 | 31,260 | 37,376 | 36,873 |
| 2010 | 32,271 | 36,742 | 40,169 | 44,966 | 40,188 | 36,978 | 38,788 | 40,896 | 38,421 | 30,041 | 33,340 | 38,316 |
| 2011 | 32,235 | 28,597 | 29,620 | 25,855 | 32,983 | 33,951 | 32,649 | 34,292 | 27,885 | 27,493 | 25,229 | 28,784 |
| 2012 | 27,780 | 26,037 | 27,226 | 30,916 | 31,858 | 28,891 | 26,922 | 30,945 | 29,206 | 33,152 | 30,920 | 32,485 |
| 2013 | 29,361 | 25,552 | 29,430 | 29,557 | 30,445 | 28,783 | 28,767 | 29,252 | 28,668 | 30,563 | 29,228 | 32,673 |
| 2014 | 30,023 | 30,319 | 31,641 | 31,040 | 33,801 | 32,444 | 33,790 | 31,755 | 32,045 | 26,937 | 27,847 | 30,109 |
| 2015 | 27,866 | 27,901 | 32,164 | 30,284 | 33,052 | 30,557 | 31,484 | 27,760 | 20,963 | 20,346 | 24,220 | 25,572 |
| 2016 | 26,557 | 23,398 | 23,680 | 30,522 | 34,512 | 32,676 | 37,073 | 32,111 | 30,262 | 30,063 | 33,846 | 33,077 |
| 2017 | 30,213 | 28,262 | 31,263 | 34,971 | 34,601 | 31,803 | 33,435 | 32,799 | 32,722 | 30,915 | 31,141 | 29,987 |
| 2018 | 21,478 | 20,613 | 31,518 | 29,247 | 27,129 | 23,741 | 25,999 | 29,521 | 29,144 | 28,032 | 32,690 | 37,738 |
| 2019 | 36,811 | 30,168 | 30,075 | 32,034 | 36,300 | 31,865 | 34,040 | 32,125 | 29,837 | 27,517 | 24,693 | 22,715 |
| 2020 | 25,341 | 22,330 | 22,459 | 22,854 | 14,000 | 14,775 | 19,251 | 14,868 | 16,986 | 19,025 | 17,246 | 15,510 |
| 2021 | 8,822 | 8,131 | 14,972 | 19,406 | 21,328 | 21,678 | 25,772 | 27,667 | 22,162 | 16,912 | 23,361 | 19,827 |
| 2022 | 14,525 | 13,037 | 22,417 | 18,632 | 22,897 | 24,511 | 24,700 | 24,840 | 20,035 | 21,955 | 19,690 | 24,644 |
| 2023 | 26,246 | 19,218 | 16,933 | 24,445 | 26,050 | 25,633 | 22,649 | 20,535 | 18,480 | 20,345 | 24,612 | 23,163 |
| 2024 | 17,273 | |||||||||||
| - = No Data Reported; -- = Not Applicable; NA = Not Available; W = Withheld to avoid disclosure of individual company data. |
| Release Date: 3/29/2024 |
| Next Release Date: 4/30/2024 |