|
Download Data (XLS File) |
|
||||||||
|
||||||||
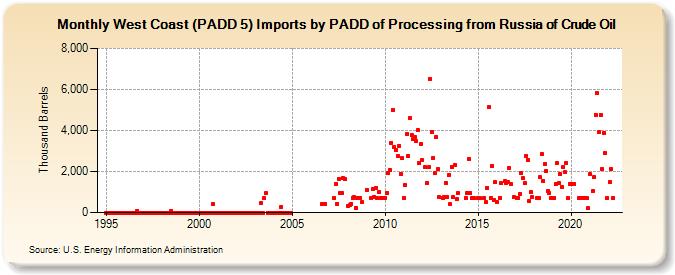
| West Coast (PADD 5) Imports by PADD of Processing from Russia of Crude Oil (Thousand Barrels) | ||||||||
| Year | Jan | Feb | Mar | Apr | May | Jun | Jul | Aug | Sep | Oct | Nov | Dec |
|---|---|---|---|---|---|---|---|---|---|---|---|---|
| 1995 | 0 | 0 | 0 | 0 | 0 | 0 | 0 | 0 | 0 | 0 | 0 | 0 |
| 1996 | 0 | 0 | 0 | 0 | 0 | 0 | 0 | 0 | 100 | 0 | 0 | 0 |
| 1997 | 0 | 0 | 0 | 0 | 0 | 0 | 0 | 0 | 0 | 0 | 0 | 0 |
| 1998 | 0 | 0 | 0 | 0 | 0 | 0 | 97 | 0 | 0 | 0 | 0 | 0 |
| 1999 | 0 | 0 | 0 | 0 | 0 | 0 | 0 | 0 | 0 | 0 | 0 | 0 |
| 2000 | 0 | 0 | 0 | 0 | 0 | 0 | 0 | 0 | 0 | 415 | 0 | 0 |
| 2001 | 0 | 0 | 0 | 0 | 0 | 0 | 0 | 0 | 0 | 0 | 0 | 0 |
| 2002 | 0 | 0 | 0 | 0 | 0 | 0 | 0 | 0 | 0 | 0 | 0 | 0 |
| 2003 | 0 | 0 | 0 | 0 | 477 | 0 | 690 | 931 | 0 | 0 | 0 | 0 |
| 2004 | 0 | 0 | 0 | 0 | 0 | 273 | 0 | 0 | 0 | 0 | 0 | 0 |
| 2006 | 409 | 428 | ||||||||||
| 2007 | 713 | 1,387 | 440 | 1,659 | 958 | 929 | 1,672 | 1,628 | ||||
| 2008 | 343 | 377 | 418 | 720 | 742 | 235 | 718 | 711 | 717 | 492 | ||
| 2009 | 1,119 | 716 | 1,160 | 771 | 1,209 | 719 | 993 | 718 | 715 | |||
| 2010 | 717 | 970 | 1,921 | 2,078 | 3,411 | 5,009 | 3,203 | 3,048 | 2,740 | 3,252 | 1,893 | 2,639 |
| 2011 | 718 | 1,329 | 3,817 | 2,734 | 4,602 | 3,768 | 3,604 | 3,674 | 3,479 | 4,000 | 2,420 | 3,340 |
| 2012 | 2,550 | 2,201 | 1,450 | 2,205 | 6,530 | 3,915 | 2,659 | 1,937 | 3,689 | 2,101 | 745 | |
| 2013 | 713 | 751 | 1,460 | 745 | 1,838 | 393 | 2,230 | 744 | 2,315 | 641 | 936 | |
| 2014 | 710 | 951 | 2,628 | 964 | 708 | 713 | ||||||
| 2015 | 710 | 698 | 705 | 492 | 1,212 | 5,122 | 710 | 2,277 | 598 | 1,466 | ||
| 2016 | 493 | 700 | 1,424 | 1,518 | 1,456 | 1,489 | 2,191 | 1,413 | 743 | |||
| 2017 | 699 | 705 | 910 | 1,905 | 1,664 | 1,423 | 2,757 | 2,583 | 556 | 995 | 745 | |
| 2018 | 702 | 704 | 1,716 | 2,858 | 1,550 | 2,355 | 2,016 | 1,036 | 948 | 702 | ||
| 2019 | 701 | 1,395 | 2,424 | 1,436 | 1,887 | 1,258 | 2,208 | 1,955 | 2,423 | 689 | 1,386 | |
| 2020 | 1,404 | 1,403 | 704 | 702 | 706 | 710 | 710 | 728 | 200 | |||
| 2021 | 1,862 | 1,047 | 1,725 | 4,745 | 5,804 | 3,925 | 4,748 | 2,127 | 3,892 | 2,893 | 705 | |
| 2022 | 1,477 | 2,106 | 709 | |||||||||
| - = No Data Reported; -- = Not Applicable; NA = Not Available; W = Withheld to avoid disclosure of individual company data. |
| Release Date: 3/29/2024 |
| Next Release Date: 4/30/2024 |