|
Download Data (XLS File) |
|
||||||||
|
||||||||
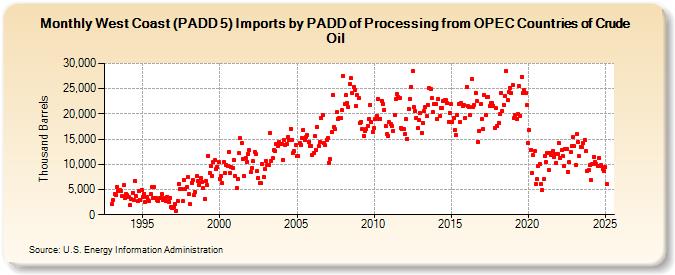
| West Coast (PADD 5) Imports by PADD of Processing from OPEC Countries of Crude Oil (Thousand Barrels) | ||||||||
| Year | Jan | Feb | Mar | Apr | May | Jun | Jul | Aug | Sep | Oct | Nov | Dec |
|---|---|---|---|---|---|---|---|---|---|---|---|---|
| 1993 | 2,166 | 2,962 | 4,115 | 3,882 | 5,483 | 4,678 | 4,905 | 4,757 | 3,620 | 5,911 | 3,267 | 4,169 |
| 1994 | 3,855 | 3,503 | 1,883 | 3,139 | 4,372 | 2,871 | 6,690 | 3,703 | 2,650 | 4,638 | 2,901 | 4,957 |
| 1995 | 3,494 | 4,159 | 2,538 | 3,514 | 2,889 | 2,653 | 4,093 | 5,410 | 3,318 | 5,503 | 3,284 | 2,943 |
| 1996 | 2,799 | 3,341 | 3,358 | 4,075 | 2,906 | 3,377 | 2,763 | 3,571 | 2,593 | 3,414 | 1,486 | 1,357 |
| 1997 | 1,514 | 2,091 | 782 | 2,738 | 6,156 | 5,127 | 5,059 | 2,651 | 6,968 | 5,112 | 5,474 | 7,506 |
| 1998 | 4,023 | 2,109 | 6,381 | 6,916 | 3,945 | 4,490 | 7,581 | 6,729 | 5,948 | 7,242 | 6,400 | 5,212 |
| 1999 | 3,125 | 6,693 | 5,819 | 11,711 | 8,334 | 9,622 | 7,725 | 10,434 | 10,757 | 9,009 | 9,521 | 10,494 |
| 2000 | 7,166 | 7,671 | 6,205 | 10,485 | 8,221 | 9,883 | 9,742 | 12,519 | 8,332 | 9,496 | 9,213 | 10,757 |
| 2001 | 7,708 | 5,258 | 7,123 | 12,164 | 15,147 | 14,198 | 11,108 | 7,703 | 11,338 | 10,470 | 12,066 | 12,810 |
| 2002 | 8,379 | 9,241 | 10,609 | 12,444 | 11,960 | 8,652 | 7,342 | 6,262 | 6,218 | 10,099 | 7,488 | 9,038 |
| 2003 | 10,617 | 9,940 | 9,934 | 16,250 | 10,630 | 11,199 | 12,788 | 12,546 | 13,933 | 13,660 | 14,457 | 14,125 |
| 2004 | 14,009 | 10,877 | 14,782 | 13,856 | 14,086 | 15,420 | 14,754 | 17,072 | 14,768 | 12,298 | 12,580 | 13,885 |
| 2005 | 11,548 | 11,601 | 14,132 | 13,909 | 15,275 | 16,873 | 14,796 | 15,407 | 15,856 | 14,428 | 13,695 | 13,594 |
| 2006 | 11,847 | 12,266 | 15,585 | 12,930 | 17,369 | 13,558 | 14,411 | 19,271 | 19,792 | 14,159 | 13,745 | 14,874 |
| 2007 | 15,215 | 10,312 | 10,977 | 16,384 | 23,815 | 17,413 | 16,937 | 20,319 | 18,905 | 19,278 | 19,179 | 20,701 |
| 2008 | 27,589 | 21,968 | 23,654 | 22,208 | 21,276 | 25,905 | 27,109 | 24,054 | 25,348 | 24,836 | 21,602 | 23,679 |
| 2009 | 23,148 | 18,241 | 18,453 | 16,959 | 15,688 | 16,525 | 16,910 | 17,659 | 18,997 | 21,844 | 18,300 | 16,500 |
| 2010 | 17,167 | 18,940 | 19,666 | 22,891 | 19,070 | 18,988 | 22,580 | 21,985 | 20,833 | 17,583 | 15,941 | 15,680 |
| 2011 | 18,335 | 17,922 | 17,564 | 16,702 | 19,837 | 22,881 | 23,954 | 23,359 | 23,224 | 17,223 | 17,076 | 16,973 |
| 2012 | 16,007 | 18,916 | 15,049 | 21,036 | 22,955 | 25,407 | 28,430 | 21,400 | 20,562 | 19,273 | 17,106 | 18,705 |
| 2013 | 20,162 | 16,196 | 18,204 | 20,482 | 21,373 | 19,569 | 21,783 | 25,132 | 24,950 | 23,146 | 20,294 | 21,993 |
| 2014 | 21,986 | 18,897 | 22,920 | 19,553 | 21,201 | 21,125 | 22,503 | 22,676 | 22,744 | 22,174 | 18,484 | 20,242 |
| 2015 | 21,937 | 18,443 | 19,204 | 16,835 | 15,723 | 19,800 | 21,966 | 18,339 | 22,114 | 21,508 | 21,838 | 19,267 |
| 2016 | 25,342 | 21,479 | 21,363 | 19,756 | 26,880 | 21,375 | 21,819 | 24,198 | 22,502 | 14,504 | 16,686 | 21,884 |
| 2017 | 18,999 | 16,916 | 23,733 | 19,776 | 23,420 | 23,423 | 21,600 | 22,136 | 22,080 | 21,637 | 17,268 | 21,080 |
| 2018 | 17,692 | 18,245 | 19,880 | 24,150 | 20,572 | 21,805 | 23,526 | 28,537 | 22,781 | 24,289 | 25,139 | 24,066 |
| 2019 | 25,638 | 19,126 | 19,731 | 19,018 | 19,889 | 25,525 | 19,541 | 27,402 | 24,164 | 24,723 | 24,142 | 21,717 |
| 2020 | 14,251 | 16,803 | 12,775 | 8,340 | 11,783 | 12,698 | 6,124 | 7,002 | 9,717 | 10,082 | 6,007 | 4,883 |
| 2021 | 7,031 | 11,654 | 10,376 | 12,310 | 8,800 | 12,190 | 11,846 | 12,636 | 11,457 | 12,066 | 10,314 | 11,981 |
| 2022 | 14,172 | 11,197 | 12,742 | 11,567 | 9,669 | 13,073 | 12,983 | 8,481 | 10,366 | 12,356 | 13,659 | 15,361 |
| 2023 | 13,545 | 9,939 | 15,999 | 14,374 | 11,564 | 13,493 | 13,409 | 14,172 | 14,871 | 12,595 | 8,722 | 8,896 |
| 2024 | 9,779 | |||||||||||
| - = No Data Reported; -- = Not Applicable; NA = Not Available; W = Withheld to avoid disclosure of individual company data. |
| Release Date: 3/29/2024 |
| Next Release Date: 4/30/2024 |