|
Download Data (XLS File) |
|
||||||||
|
||||||||
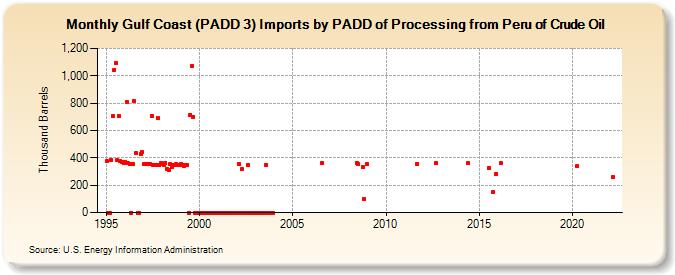
| Gulf Coast (PADD 3) Imports by PADD of Processing from Peru of Crude Oil (Thousand Barrels) | ||||||||
| Year | Jan | Feb | Mar | Apr | May | Jun | Jul | Aug | Sep | Oct | Nov | Dec |
|---|---|---|---|---|---|---|---|---|---|---|---|---|
| 1995 | 375 | 0 | 0 | 385 | 704 | 1,044 | 1,092 | 384 | 703 | 380 | 367 | 361 |
| 1996 | 373 | 810 | 360 | 356 | 0 | 353 | 813 | 435 | 0 | 0 | 430 | 441 |
| 1997 | 353 | 356 | 355 | 357 | 357 | 706 | 348 | 345 | 345 | 692 | 345 | 360 |
| 1998 | 356 | 349 | 365 | 322 | 314 | 354 | 336 | 346 | 344 | 352 | 348 | 348 |
| 1999 | 353 | 350 | 343 | 345 | 344 | 0 | 716 | 1,073 | 702 | 0 | 0 | 0 |
| 2000 | 0 | 0 | 0 | 0 | 0 | 0 | 0 | 0 | 0 | 0 | 0 | 0 |
| 2001 | 0 | 0 | 0 | 0 | 0 | 0 | 0 | 0 | 0 | 0 | 0 | 0 |
| 2002 | 0 | 358 | 0 | 317 | 0 | 0 | 0 | 344 | 0 | 0 | 0 | 0 |
| 2003 | 0 | 0 | 0 | 0 | 0 | 0 | 0 | 348 | 0 | 0 | 0 | 0 |
| 2006 | 363 | |||||||||||
| 2008 | 360 | 355 | 334 | 100 | ||||||||
| 2009 | 353 | |||||||||||
| 2011 | 357 | |||||||||||
| 2012 | 362 | |||||||||||
| 2014 | 359 | |||||||||||
| 2015 | 326 | 148 | 283 | |||||||||
| 2016 | 360 | |||||||||||
| 2020 | 339 | |||||||||||
| 2022 | 259 | |||||||||||
| - = No Data Reported; -- = Not Applicable; NA = Not Available; W = Withheld to avoid disclosure of individual company data. |
| Release Date: 8/30/2024 |
| Next Release Date: 9/30/2024 |