|
Download Data (XLS File) |
|
||||||||
|
||||||||
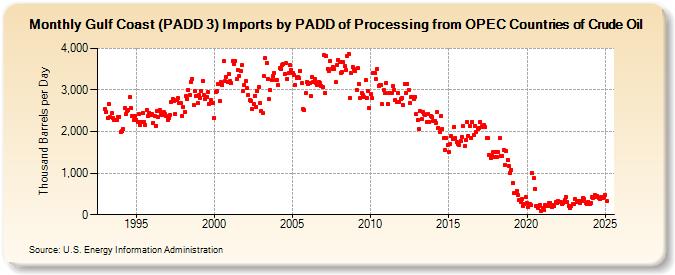
| Gulf Coast (PADD 3) Imports by PADD of Processing from OPEC Countries of Crude Oil (Thousand Barrels per Day) | ||||||||
| Year | Jan | Feb | Mar | Apr | May | Jun | Jul | Aug | Sep | Oct | Nov | Dec |
|---|---|---|---|---|---|---|---|---|---|---|---|---|
| 1993 | 2,545 | 2,476 | 2,320 | 2,664 | 2,339 | 2,444 | 2,335 | 2,279 | 2,273 | 2,285 | 2,352 | 2,362 |
| 1994 | 1,984 | 2,013 | 2,057 | 2,561 | 2,415 | 2,487 | 2,514 | 2,825 | 2,565 | 2,372 | 2,281 | 2,371 |
| 1995 | 2,288 | 2,234 | 2,420 | 2,164 | 2,227 | 2,448 | 2,237 | 2,162 | 2,527 | 2,365 | 2,458 | 2,395 |
| 1996 | 2,420 | 2,214 | 2,364 | 2,145 | 2,495 | 2,356 | 2,529 | 2,450 | 2,395 | 2,459 | 2,415 | 2,375 |
| 1997 | 2,287 | 2,322 | 2,409 | 2,718 | 2,785 | 2,746 | 2,420 | 2,764 | 2,797 | 2,677 | 2,680 | 2,385 |
| 1998 | 2,589 | 2,480 | 2,854 | 2,787 | 3,008 | 2,890 | 3,191 | 3,264 | 2,635 | 2,974 | 2,860 | 2,698 |
| 1999 | 2,882 | 2,809 | 2,966 | 3,219 | 2,881 | 2,780 | 2,822 | 2,940 | 2,671 | 2,757 | 2,696 | 2,682 |
| 2000 | 2,326 | 2,940 | 2,967 | 3,134 | 2,726 | 3,184 | 3,120 | 3,695 | 3,210 | 3,318 | 3,184 | 3,381 |
| 2001 | 3,216 | 3,158 | 3,702 | 3,636 | 3,692 | 3,252 | 3,471 | 3,336 | 3,446 | 3,591 | 2,970 | 3,120 |
| 2002 | 3,210 | 3,041 | 2,874 | 2,757 | 2,733 | 2,542 | 2,662 | 2,861 | 2,597 | 2,967 | 3,080 | 2,676 |
| 2003 | 2,495 | 2,442 | 3,329 | 3,763 | 3,652 | 3,262 | 2,777 | 2,997 | 3,229 | 3,324 | 3,415 | 3,243 |
| 2004 | 3,239 | 3,110 | 3,524 | 3,494 | 3,600 | 3,615 | 3,382 | 3,641 | 3,268 | 3,410 | 3,589 | 3,487 |
| 2005 | 3,411 | 3,356 | 3,116 | 3,292 | 3,318 | 3,284 | 3,468 | 3,156 | 2,544 | 2,514 | 2,920 | 3,195 |
| 2006 | 3,144 | 3,174 | 2,845 | 3,309 | 3,192 | 3,272 | 3,163 | 3,129 | 3,195 | 3,175 | 3,102 | 3,076 |
| 2007 | 3,839 | 2,938 | 3,816 | 3,511 | 3,458 | 3,708 | 3,506 | 3,546 | 3,514 | 3,183 | 3,602 | 3,718 |
| 2008 | 3,676 | 3,420 | 3,444 | 3,666 | 3,575 | 3,491 | 3,811 | 3,873 | 2,818 | 3,398 | 3,554 | 3,498 |
| 2009 | 3,456 | 3,002 | 3,526 | 3,149 | 2,815 | 2,926 | 2,889 | 2,820 | 3,232 | 2,805 | 2,982 | 2,563 |
| 2010 | 2,895 | 2,800 | 3,411 | 3,408 | 3,264 | 3,507 | 3,105 | 3,114 | 3,110 | 2,653 | 2,993 | 2,931 |
| 2011 | 3,179 | 2,668 | 2,935 | 2,916 | 2,925 | 3,090 | 3,009 | 2,759 | 2,701 | 2,937 | 2,714 | 2,783 |
| 2012 | 2,806 | 2,633 | 3,135 | 2,933 | 3,153 | 3,008 | 2,690 | 2,823 | 2,830 | 2,775 | 2,835 | 2,418 |
| 2013 | 2,278 | 2,060 | 2,483 | 2,295 | 2,469 | 2,422 | 2,395 | 2,230 | 2,419 | 2,238 | 2,369 | 2,358 |
| 2014 | 2,255 | 2,251 | 2,205 | 2,463 | 2,095 | 1,985 | 2,372 | 2,067 | 1,847 | 1,545 | 1,847 | 1,665 |
| 2015 | 1,514 | 1,706 | 1,892 | 1,828 | 2,111 | 1,848 | 1,751 | 1,695 | 1,681 | 1,772 | 1,877 | 2,144 |
| 2016 | 1,652 | 1,792 | 2,225 | 1,902 | 2,141 | 1,851 | 2,227 | 1,917 | 2,141 | 1,990 | 2,067 | 2,084 |
| 2017 | 2,240 | 2,123 | 2,107 | 2,169 | 2,110 | 1,845 | 1,836 | 1,443 | 1,374 | 1,417 | 1,505 | 1,399 |
| 2018 | 1,501 | 1,383 | 1,508 | 1,850 | 1,414 | 1,423 | 1,555 | 1,205 | 1,526 | 1,316 | 1,183 | 1,011 |
| 2019 | 1,076 | 773 | 513 | 515 | 581 | 463 | 359 | 304 | 369 | 203 | 253 | 422 |
| 2020 | 284 | 197 | 259 | 239 | 1,001 | 879 | 620 | 202 | 171 | 202 | 228 | 86 |
| 2021 | 157 | 102 | 224 | 204 | 211 | 279 | 282 | 184 | 232 | 204 | 300 | 283 |
| 2022 | 324 | 299 | 302 | 262 | 287 | 352 | 429 | 302 | 214 | 163 | 213 | 258 |
| 2023 | 259 | 371 | 328 | 300 | 332 | 283 | 335 | 423 | 381 | 291 | 252 | 313 |
| 2024 | 267 | |||||||||||
| - = No Data Reported; -- = Not Applicable; NA = Not Available; W = Withheld to avoid disclosure of individual company data. |
| Release Date: 3/29/2024 |
| Next Release Date: 4/30/2024 |