|
Download Data (XLS File) |
|
||||||||
|
||||||||
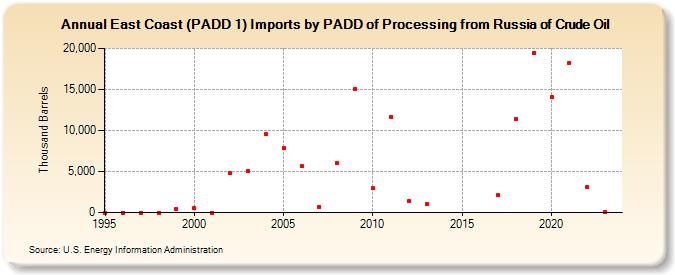
| East Coast (PADD 1) Imports by PADD of Processing from Russia of Crude Oil (Thousand Barrels) | ||||||||
| Decade | Year-0 | Year-1 | Year-2 | Year-3 | Year-4 | Year-5 | Year-6 | Year-7 | Year-8 | Year-9 |
|---|---|---|---|---|---|---|---|---|---|---|
| 1990's | 0 | 0 | 0 | 0 | 474 | |||||
| 2000's | 526 | 0 | 4,775 | 5,085 | 9,535 | 7,868 | 5,630 | 738 | 6,054 | 15,002 |
| 2010's | 2,947 | 11,637 | 1,392 | 1,055 | 2,110 | 11,400 | 19,465 | |||
| 2020's | 14,033 | 18,194 | 3,098 | 10 |
| - = No Data Reported; -- = Not Applicable; NA = Not Available; W = Withheld to avoid disclosure of individual company data. |
| Release Date: 6/30/2025 |
| Next Release Date: 8/29/2025 |