|
Download Data (XLS File) |
|
||||||||
|
||||||||
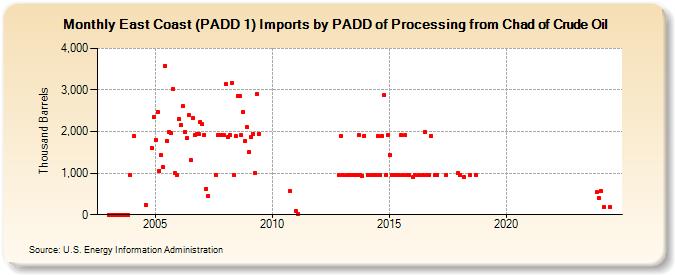
| East Coast (PADD 1) Imports by PADD of Processing from Chad of Crude Oil (Thousand Barrels) | ||||||||
| Year | Jan | Feb | Mar | Apr | May | Jun | Jul | Aug | Sep | Oct | Nov | Dec |
|---|---|---|---|---|---|---|---|---|---|---|---|---|
| 2003 | 0 | 0 | 0 | 0 | 0 | 0 | 0 | 0 | 0 | 0 | 0 | 954 |
| 2004 | 1,898 | 238 | 1,605 | 2,348 | ||||||||
| 2005 | 1,802 | 2,482 | 1,059 | 1,429 | 1,139 | 3,588 | 1,769 | 1,997 | 1,957 | 3,020 | 999 | 954 |
| 2006 | 2,301 | 2,162 | 2,605 | 1,991 | 1,837 | 2,388 | 1,312 | 2,330 | 1,909 | 1,947 | 1,951 | 2,226 |
| 2007 | 2,174 | 1,912 | 619 | 449 | 954 | 1,915 | 1,908 | 1,907 | 1,908 | |||
| 2008 | 3,139 | 1,873 | 1,908 | 3,176 | 952 | 1,882 | 2,855 | 2,865 | 1,910 | 2,466 | 1,765 | 2,103 |
| 2009 | 1,503 | 1,877 | 1,938 | 993 | 2,906 | 1,948 | ||||||
| 2010 | 565 | |||||||||||
| 2011 | 92 | 15 | ||||||||||
| 2012 | 953 | 1,905 | ||||||||||
| 2013 | 955 | 955 | 953 | 955 | 954 | 951 | 952 | 1,908 | 953 | 933 | 1,904 | |
| 2014 | 951 | 953 | 952 | 952 | 1,901 | 953 | 1,904 | 2,869 | 956 | 1,915 | ||
| 2015 | 1,434 | 956 | 955 | 956 | 954 | 950 | 1,909 | 954 | 1,909 | 954 | 950 | |
| 2016 | 908 | 949 | 955 | 950 | 1,995 | 951 | 949 | 1,901 | 951 | |||
| 2017 | 951 | 952 | 996 | |||||||||
| 2018 | 951 | 903 | 952 | 950 | ||||||||
| 2023 | 543 | 403 | ||||||||||
| 2024 | 573 | |||||||||||
| - = No Data Reported; -- = Not Applicable; NA = Not Available; W = Withheld to avoid disclosure of individual company data. |
| Release Date: 3/29/2024 |
| Next Release Date: 4/30/2024 |