|
Download Data (XLS File) |
|
||||||||
|
||||||||
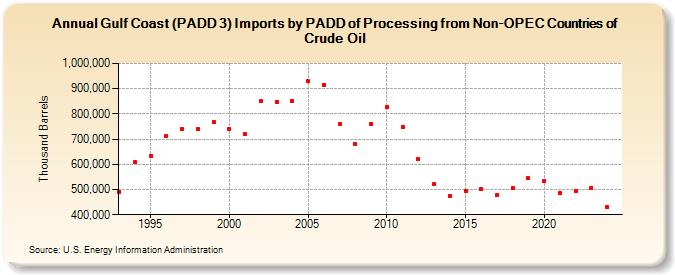
| Gulf Coast (PADD 3) Imports by PADD of Processing from Non-OPEC Countries of Crude Oil (Thousand Barrels) | ||||||||
| Decade | Year-0 | Year-1 | Year-2 | Year-3 | Year-4 | Year-5 | Year-6 | Year-7 | Year-8 | Year-9 |
|---|---|---|---|---|---|---|---|---|---|---|
| 1990's | 491,821 | 608,866 | 632,983 | 712,727 | 740,429 | 740,110 | 767,338 | |||
| 2000's | 741,910 | 718,548 | 849,246 | 849,086 | 849,227 | 928,991 | 915,836 | 758,787 | 678,804 | 757,955 |
| 2010's | 828,141 | 747,904 | 622,789 | 520,939 | 475,940 | 495,825 | 500,283 | 476,367 | 504,349 | 543,811 |
| 2020's | 532,775 | 486,077 | 494,033 | 455,765 |
| - = No Data Reported; -- = Not Applicable; NA = Not Available; W = Withheld to avoid disclosure of individual company data. |
| Release Date: 4/30/2024 |
| Next Release Date: 8/30/2024 |