|
Download Data (XLS File) |
|
||||||||
|
||||||||
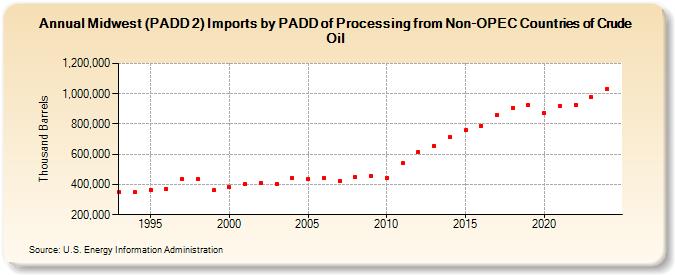
| Midwest (PADD 2) Imports by PADD of Processing from Non-OPEC Countries of Crude Oil (Thousand Barrels) | ||||||||
| Decade | Year-0 | Year-1 | Year-2 | Year-3 | Year-4 | Year-5 | Year-6 | Year-7 | Year-8 | Year-9 |
|---|---|---|---|---|---|---|---|---|---|---|
| 1990's | 347,136 | 349,174 | 365,639 | 370,534 | 437,657 | 437,592 | 360,132 | |||
| 2000's | 381,381 | 401,202 | 412,055 | 403,152 | 444,583 | 435,408 | 442,933 | 420,369 | 446,569 | 457,489 |
| 2010's | 445,159 | 540,259 | 615,284 | 656,322 | 712,605 | 758,347 | 788,979 | 859,978 | 907,838 | 923,180 |
| 2020's | 872,634 | 920,887 | 927,832 | 1,026,164 |
| - = No Data Reported; -- = Not Applicable; NA = Not Available; W = Withheld to avoid disclosure of individual company data. |
| Release Date: 6/28/2024 |
| Next Release Date: 8/30/2024 |