|
Download Data (XLS File) |
|
||||||||
|
||||||||
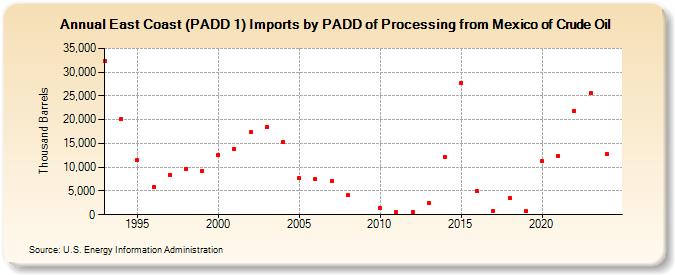
| East Coast (PADD 1) Imports by PADD of Processing from Mexico of Crude Oil (Thousand Barrels) | ||||||||
| Decade | Year-0 | Year-1 | Year-2 | Year-3 | Year-4 | Year-5 | Year-6 | Year-7 | Year-8 | Year-9 |
|---|---|---|---|---|---|---|---|---|---|---|
| 1990's | 32,251 | 20,062 | 11,460 | 5,866 | 8,423 | 9,707 | 9,288 | |||
| 2000's | 12,583 | 13,842 | 17,303 | 18,442 | 15,386 | 7,674 | 7,512 | 7,064 | 4,097 | |
| 2010's | 1,371 | 546 | 623 | 2,547 | 12,162 | 27,807 | 4,941 | 846 | 3,469 | 698 |
| 2020's | 11,237 | 12,400 | 21,843 | 25,603 |
| - = No Data Reported; -- = Not Applicable; NA = Not Available; W = Withheld to avoid disclosure of individual company data. |
| Release Date: 8/30/2024 |
| Next Release Date: 8/29/2025 |