|
Download Data (XLS File) |
|
||||||||
|
||||||||
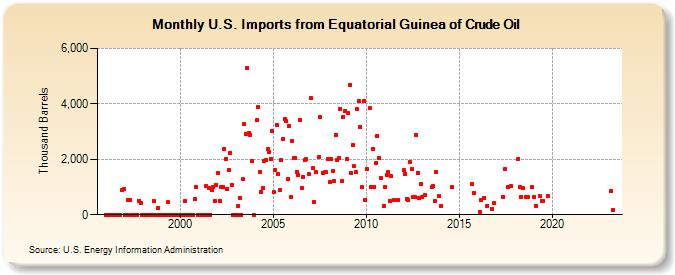
| U.S. Imports from Equatorial Guinea of Crude Oil (Thousand Barrels) | ||||||||
| Year | Jan | Feb | Mar | Apr | May | Jun | Jul | Aug | Sep | Oct | Nov | Dec |
|---|---|---|---|---|---|---|---|---|---|---|---|---|
| 1996 | 0 | 0 | 0 | 0 | 0 | 0 | 0 | 0 | 0 | 0 | 888 | 929 |
| 1997 | 0 | 0 | 520 | 519 | 0 | 0 | 0 | 0 | 0 | 508 | 425 | 0 |
| 1998 | 0 | 0 | 0 | 0 | 0 | 0 | 0 | 491 | 0 | 241 | 0 | 0 |
| 1999 | 0 | 0 | 0 | 0 | 453 | 0 | 0 | 0 | 0 | 0 | 0 | 0 |
| 2000 | 0 | 0 | 0 | 491 | 0 | 0 | 0 | 0 | 0 | 568 | 1,008 | 0 |
| 2001 | 0 | 0 | 0 | 0 | 1,030 | 0 | 949 | 0 | 900 | 997 | 502 | 1,087 |
| 2002 | 1,495 | 501 | 994 | 997 | 2,381 | 2,022 | 936 | 1,622 | 2,233 | 1,062 | 0 | 0 |
| 2003 | 0 | 324 | 609 | 0 | 1,278 | 3,266 | 2,918 | 5,281 | 2,944 | 2,885 | 1,947 | 0 |
| 2004 | 3,399 | 3,884 | 1,541 | 828 | 974 | 1,948 | 1,982 | 2,359 | 2,270 | 2,023 | 3,004 | |
| 2005 | 827 | 1,628 | 3,241 | 1,451 | 909 | 1,974 | 2,745 | 3,457 | 3,387 | 1,277 | 3,212 | 626 |
| 2006 | 2,664 | 2,037 | 2,028 | 1,540 | 1,428 | 3,431 | 956 | 1,369 | 1,966 | 2,000 | 1,475 | |
| 2007 | 4,218 | 1,681 | 472 | 1,534 | 2,067 | 3,514 | 1,520 | 1,523 | 1,533 | 2,008 | ||
| 2008 | 1,189 | 1,992 | 1,579 | 1,208 | 2,877 | 1,982 | 2,051 | 3,821 | 1,199 | 3,543 | 3,724 | 1,994 |
| 2009 | 3,653 | 4,677 | 1,504 | 2,509 | 1,745 | 1,523 | 3,806 | 4,085 | 3,176 | 999 | 4,093 | 540 |
| 2010 | 1,642 | 3,839 | 997 | 2,385 | 994 | 1,848 | 2,834 | 2,047 | 1,333 | 306 | ||
| 2011 | 995 | 1,445 | 1,545 | 508 | 1,381 | 514 | 546 | |||||
| 2012 | 1,596 | 1,455 | 577 | 518 | 1,900 | 1,666 | 653 | 650 | 2,866 | 1,522 | 597 | 1,100 |
| 2013 | 650 | 706 | 994 | 1,019 | 500 | 1,532 | 671 | |||||
| 2014 | 327 | 996 | ||||||||||
| 2015 | 1,097 | 785 | ||||||||||
| 2016 | 108 | 542 | 620 | 332 | 216 | 432 | ||||||
| 2017 | 647 | 1,634 | 1,003 | 1,044 | ||||||||
| 2018 | 2,004 | 994 | 649 | 949 | 645 | 649 | 991 | |||||
| 2019 | 653 | 306 | 663 | 496 | 505 | 663 | ||||||
| 2023 | 863 | 166 | ||||||||||
| - = No Data Reported; -- = Not Applicable; NA = Not Available; W = Withheld to avoid disclosure of individual company data. |
| Release Date: 3/29/2024 |
| Next Release Date: 4/30/2024 |