|
Download Data (XLS File) |
|
||||||||
|
||||||||
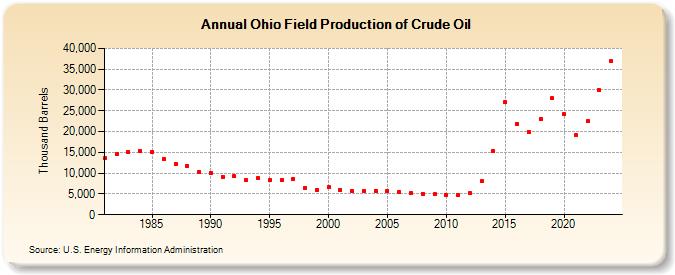
| Ohio Field Production of Crude Oil (Thousand Barrels) | ||||||||
| Decade | Year-0 | Year-1 | Year-2 | Year-3 | Year-4 | Year-5 | Year-6 | Year-7 | Year-8 | Year-9 |
|---|---|---|---|---|---|---|---|---|---|---|
| 1980's | 13,551 | 14,571 | 14,971 | 15,271 | 14,988 | 13,442 | 12,153 | 11,711 | 10,215 | |
| 1990's | 10,008 | 9,156 | 9,197 | 8,282 | 8,758 | 8,258 | 8,305 | 8,593 | 6,541 | 5,970 |
| 2000's | 6,575 | 6,051 | 5,631 | 5,658 | 5,783 | 5,658 | 5,439 | 5,155 | 5,088 | 4,890 |
| 2010's | 4,772 | 4,657 | 5,123 | 8,038 | 15,224 | 27,104 | 21,932 | 19,960 | 22,985 | 27,964 |
| 2020's | 24,148 | 19,090 | 22,431 | 29,896 |
| - = No Data Reported; -- = Not Applicable; NA = Not Available; W = Withheld to avoid disclosure of individual company data. |
| Release Date: 8/30/2024 |
| Next Release Date: 8/29/2025 |
Referring Pages: