|
Download Data (XLS File) |
|
||||||||
|
||||||||
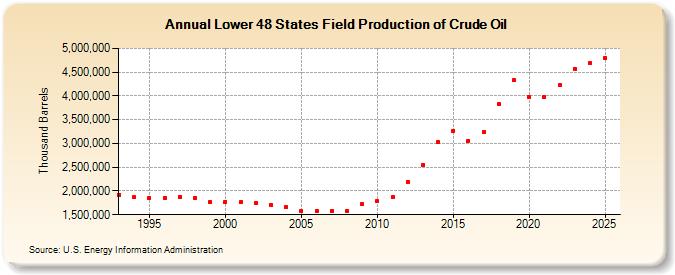
| Lower 48 States Field Production of Crude Oil (Thousand Barrels) | ||||||||
| Decade | Year-0 | Year-1 | Year-2 | Year-3 | Year-4 | Year-5 | Year-6 | Year-7 | Year-8 | Year-9 |
|---|---|---|---|---|---|---|---|---|---|---|
| 1990's | 1,921,539 | 1,862,529 | 1,852,615 | 1,856,017 | 1,881,882 | 1,853,069 | 1,763,533 | |||
| 2000's | 1,775,509 | 1,766,099 | 1,737,207 | 1,706,392 | 1,658,954 | 1,576,708 | 1,585,860 | 1,588,378 | 1,579,986 | 1,719,684 |
| 2010's | 1,782,902 | 1,866,257 | 2,195,299 | 2,547,898 | 3,027,513 | 3,269,164 | 3,058,417 | 3,234,901 | 3,822,379 | 4,323,597 |
| 2020's | 3,978,652 | 3,953,098 | 4,187,766 | 4,563,937 |
| - = No Data Reported; -- = Not Applicable; NA = Not Available; W = Withheld to avoid disclosure of individual company data. |
| Release Date: 3/29/2024 |
| Next Release Date: 8/30/2024 |
Referring Pages: