|
Download Data (XLS File) |
|
||||||||
|
||||||||
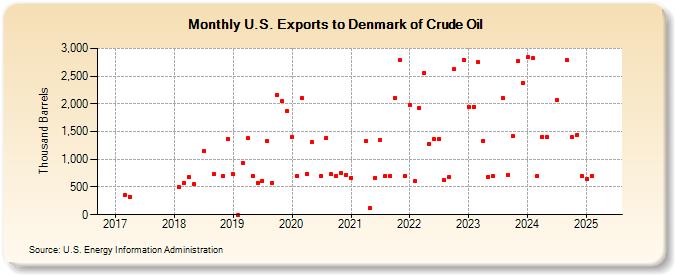
| U.S. Exports to Denmark of Crude Oil (Thousand Barrels) | ||||||||
| Year | Jan | Feb | Mar | Apr | May | Jun | Jul | Aug | Sep | Oct | Nov | Dec |
|---|---|---|---|---|---|---|---|---|---|---|---|---|
| 2017 | 357 | 326 | ||||||||||
| 2018 | 494 | 571 | 675 | 547 | 1,145 | 734 | 691 | 1,372 | ||||
| 2019 | 730 | 0 | 940 | 1,375 | 700 | 574 | 615 | 1,326 | 573 | 2,163 | 2,048 | 1,863 |
| 2020 | 1,399 | 698 | 2,103 | 735 | 1,309 | 700 | 1,390 | 726 | 697 | 756 | 725 | |
| 2021 | 665 | 1,324 | 120 | 667 | 1,340 | 701 | 702 | 2,112 | 2,784 | 696 | ||
| 2022 | 1,985 | 600 | 1,933 | 2,557 | 1,280 | 1,361 | 1,363 | 621 | 684 | 2,620 | 2,799 | |
| 2023 | 1,950 | 1,948 | 2,746 | 1,338 | 683 | 694 | 2,102 | 725 | 1,416 | 2,766 | 2,384 | |
| 2024 | 2,836 | 2,820 | 694 | 1,407 | 1,394 | |||||||
| - = No Data Reported; -- = Not Applicable; NA = Not Available; W = Withheld to avoid disclosure of individual company data. |
| Release Date: 8/30/2024 |
| Next Release Date: 9/30/2024 |