|
Download Data (XLS File) |
|
||||||||
|
||||||||
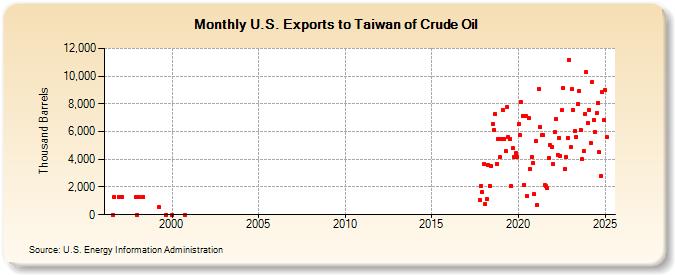
| U.S. Exports to Taiwan of Crude Oil (Thousand Barrels) | ||||||||
| Year | Jan | Feb | Mar | Apr | May | Jun | Jul | Aug | Sep | Oct | Nov | Dec |
|---|---|---|---|---|---|---|---|---|---|---|---|---|
| 1996 | 14 | 1,297 | 1,300 | |||||||||
| 1997 | 1,281 | 1,289 | ||||||||||
| 1998 | 2 | 1,290 | 1,304 | |||||||||
| 1999 | 553 | 7 | ||||||||||
| 2000 | 12 | 0 | ||||||||||
| 2017 | 1,049 | 2,097 | 1,620 | |||||||||
| 2018 | 3,658 | 741 | 1,158 | 3,610 | 2,079 | 3,509 | 6,528 | 6,147 | 7,265 | 3,683 | 5,473 | 4,129 |
| 2019 | 5,463 | 7,581 | 5,452 | 4,563 | 7,758 | 5,575 | 5,491 | 2,085 | 4,791 | 4,172 | 4,438 | 4,179 |
| 2020 | 6,509 | 5,734 | 8,121 | 7,150 | 2,162 | 7,115 | 1,353 | 6,951 | 3,307 | 4,168 | 3,756 | 1,468 |
| 2021 | 5,296 | 695 | 9,054 | 6,325 | 5,724 | 5,781 | 2,119 | 2,050 | 1,908 | 4,093 | 5,011 | 4,889 |
| 2022 | 3,625 | 5,964 | 6,910 | 4,323 | 5,564 | 4,255 | 7,533 | 9,140 | 3,266 | 4,178 | 5,535 | 11,193 |
| 2023 | 5,557 | 6,350 | 7,569 | 6,039 | 5,629 | 10,766 | 6,159 | 6,129 | 3,999 | 4,563 | 8,126 | 9,419 |
| 2024 | 6,649 | |||||||||||
| - = No Data Reported; -- = Not Applicable; NA = Not Available; W = Withheld to avoid disclosure of individual company data. |
| Release Date: 3/29/2024 |
| Next Release Date: 4/30/2024 |