|
Download Data (XLS File) |
|
||||||||
|
||||||||
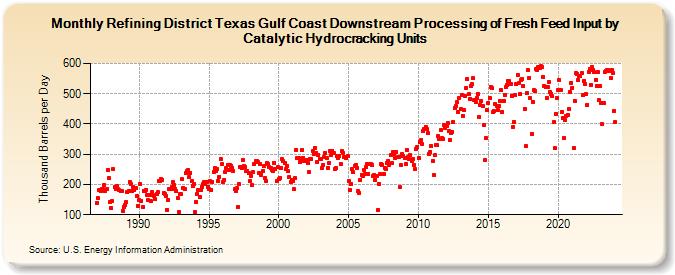
| Refining District Texas Gulf Coast Downstream Processing of Fresh Feed Input by Catalytic Hydrocracking Units (Thousand Barrels per Day) | ||||||||
| Year | Jan | Feb | Mar | Apr | May | Jun | Jul | Aug | Sep | Oct | Nov | Dec |
|---|---|---|---|---|---|---|---|---|---|---|---|---|
| 1987 | 140 | 154 | 181 | 178 | 186 | 184 | 199 | 179 | 184 | 249 | 221 | 142 |
| 1988 | 122 | 144 | 250 | 191 | 186 | 194 | 185 | 182 | 180 | 180 | 113 | 127 |
| 1989 | 132 | 142 | 174 | 177 | 208 | 202 | 179 | 192 | 182 | 188 | 163 | 130 |
| 1990 | 148 | 200 | 146 | 126 | 178 | 177 | 183 | 166 | 147 | 166 | 144 | 174 |
| 1991 | 165 | 162 | 151 | 170 | 174 | 213 | 210 | 218 | 215 | 171 | 168 | 162 |
| 1992 | 117 | 149 | 186 | 186 | 191 | 208 | 199 | 185 | 177 | 156 | 110 | 170 |
| 1993 | 167 | 217 | 189 | 184 | 238 | 244 | 248 | 224 | 238 | 210 | 195 | 202 |
| 1994 | 108 | 142 | 169 | 182 | 159 | 183 | 193 | 202 | 208 | 203 | 207 | 192 |
| 1995 | 184 | 211 | 181 | 209 | 242 | 254 | 245 | 250 | 211 | 226 | 283 | 267 |
| 1996 | 207 | 215 | 242 | 253 | 265 | 249 | 264 | 262 | 256 | 244 | 184 | 179 |
| 1997 | 187 | 126 | 201 | 259 | 255 | 281 | 262 | 258 | 245 | 244 | 238 | 212 |
| 1998 | 229 | 199 | 241 | 267 | 277 | 277 | 274 | 239 | 267 | 232 | 245 | 261 |
| 1999 | 221 | 213 | 271 | 267 | 257 | 254 | 249 | 244 | 271 | 250 | 211 | 257 |
| 2000 | 218 | 223 | 254 | 283 | 277 | 271 | 250 | 262 | 244 | 225 | 209 | 216 |
| 2001 | 213 | 184 | 221 | 314 | 288 | 289 | 275 | 285 | 315 | 289 | 276 | 282 |
| 2002 | 282 | 271 | 240 | 283 | 284 | 310 | 302 | 322 | 304 | 274 | 298 | 285 |
| 2003 | 284 | 256 | 265 | 291 | 304 | 288 | 256 | 272 | 310 | 297 | 312 | 303 |
| 2004 | 252 | 253 | 295 | 288 | 294 | 269 | 311 | 305 | 290 | 291 | 286 | 293 |
| 2005 | 211 | 182 | 200 | 252 | 240 | 262 | 266 | 255 | 179 | 173 | 214 | 232 |
| 2006 | 228 | 248 | 236 | 259 | 269 | 236 | 268 | 267 | 263 | 228 | 232 | 215 |
| 2007 | 228 | 114 | 203 | 234 | 269 | 265 | 235 | 253 | 250 | 272 | 279 | 266 |
| 2008 | 297 | 270 | 307 | 302 | 288 | 307 | 290 | 290 | 190 | 263 | 301 | 294 |
| 2009 | 286 | 267 | 315 | 291 | 283 | 297 | 279 | 285 | 266 | 251 | 318 | 324 |
| 2010 | 287 | 340 | 346 | 334 | 376 | 384 | 391 | 384 | 369 | 302 | 308 | 327 |
| 2011 | 278 | 231 | 296 | 330 | 329 | 359 | 351 | 379 | 352 | 351 | 397 | 387 |
| 2012 | 393 | 403 | 377 | 347 | 370 | 375 | 405 | 454 | 458 | 472 | 441 | 486 |
| 2013 | 450 | 495 | 428 | 446 | 493 | 520 | 548 | 498 | 484 | 525 | 531 | 551 |
| 2014 | 478 | 471 | 486 | 500 | 423 | 462 | 475 | 461 | 396 | 280 | 353 | 446 |
| 2015 | 470 | 486 | 523 | 518 | 438 | 442 | 466 | 460 | 447 | 459 | 475 | 511 |
| 2016 | 440 | 477 | 497 | 522 | 529 | 543 | 542 | 532 | 493 | 391 | 408 | 496 |
| 2017 | 532 | 562 | 534 | 499 | 547 | 549 | 526 | 451 | 326 | 501 | 579 | 553 |
| 2018 | 485 | 368 | 474 | 511 | 510 | 583 | 579 | 587 | 584 | 591 | 589 | 556 |
| 2019 | 526 | 522 | 486 | 523 | 540 | 506 | 500 | 491 | 405 | 319 | 434 | 487 |
| 2020 | 512 | 545 | 512 | 441 | 419 | 354 | 412 | 428 | 430 | 449 | 505 | 536 |
| 2021 | 520 | 322 | 477 | 568 | 566 | 546 | 560 | 557 | 568 | 496 | 543 | 533 |
| 2022 | 499 | 464 | 573 | 581 | 530 | 588 | 580 | 571 | 547 | 526 | 571 | 478 |
| 2023 | 524 | 468 | 399 | 469 | 572 | 576 | 578 | 579 | 575 | 552 | 579 | 568 |
| 2024 | 443 | |||||||||||
| - = No Data Reported; -- = Not Applicable; NA = Not Available; W = Withheld to avoid disclosure of individual company data. |
| Release Date: 3/29/2024 |
| Next Release Date: 4/30/2024 |