|
Download Data (XLS File) |
|
||||||||
|
||||||||
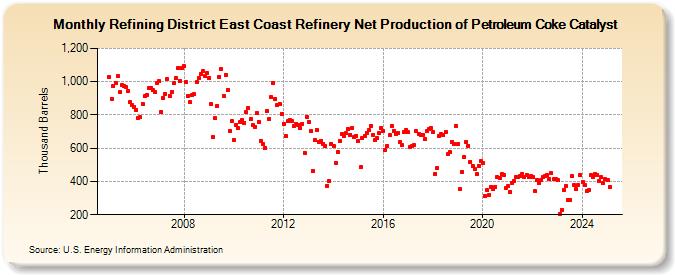
| Refining District East Coast Refinery Net Production of Petroleum Coke Catalyst (Thousand Barrels) | ||||||||
| Year | Jan | Feb | Mar | Apr | May | Jun | Jul | Aug | Sep | Oct | Nov | Dec |
|---|---|---|---|---|---|---|---|---|---|---|---|---|
| 2005 | 1,027 | 898 | 971 | 994 | 1,032 | 935 | 981 | 975 | 965 | 945 | 876 | 861 |
| 2006 | 848 | 830 | 784 | 786 | 867 | 912 | 920 | 963 | 964 | 949 | 938 | 993 |
| 2007 | 1,002 | 820 | 903 | 928 | 1,013 | 916 | 937 | 990 | 1,023 | 1,081 | 1,005 | 1,085 |
| 2008 | 1,092 | 995 | 916 | 876 | 920 | 923 | 997 | 1,021 | 1,045 | 1,062 | 1,031 | 1,052 |
| 2009 | 1,022 | 864 | 665 | 780 | 853 | 1,030 | 1,075 | 913 | 1,042 | 950 | 704 | 761 |
| 2010 | 651 | 740 | 721 | 760 | 770 | 753 | 815 | 844 | 774 | 739 | 728 | 813 |
| 2011 | 759 | 646 | 625 | 603 | 826 | 776 | 906 | 992 | 896 | 859 | 863 | 806 |
| 2012 | 748 | 672 | 763 | 770 | 763 | 735 | 748 | 740 | 722 | 746 | 574 | 789 |
| 2013 | 756 | 705 | 463 | 648 | 712 | 639 | 646 | 626 | 613 | 375 | 400 | 628 |
| 2014 | 611 | 511 | 578 | 641 | 685 | 672 | 689 | 714 | 681 | 721 | 666 | 676 |
| 2015 | 645 | 484 | 662 | 674 | 694 | 708 | 733 | 682 | 649 | 660 | 694 | 723 |
| 2016 | 703 | 587 | 612 | 677 | 734 | 704 | 685 | 691 | 636 | 617 | 698 | 711 |
| 2017 | 695 | 608 | 612 | 617 | 701 | 686 | 682 | 681 | 653 | 702 | 714 | 720 |
| 2018 | 698 | 447 | 482 | 671 | 684 | 679 | 698 | 563 | 576 | 638 | 628 | 734 |
| 2019 | 628 | 353 | 459 | 550 | 638 | 614 | 518 | 494 | 477 | 444 | 495 | 520 |
| 2020 | 510 | 312 | 346 | 321 | 368 | 353 | 369 | 424 | 418 | 443 | 440 | 362 |
| 2021 | 371 | 337 | 393 | 404 | 427 | 426 | 432 | 446 | 424 | 441 | 426 | 434 |
| 2022 | 426 | 341 | 410 | 392 | 407 | 428 | 430 | 437 | 414 | 448 | 412 | 414 |
| 2023 | 408 | 206 | 231 | 154 | 175 | 212 | 287 | 431 | 378 | 353 | 380 | 439 |
| 2024 | 399 | |||||||||||
| - = No Data Reported; -- = Not Applicable; NA = Not Available; W = Withheld to avoid disclosure of individual company data. |
| Release Date: 3/29/2024 |
| Next Release Date: 4/30/2024 |