|
Download Data (XLS File) |
|
||||||||
|
||||||||
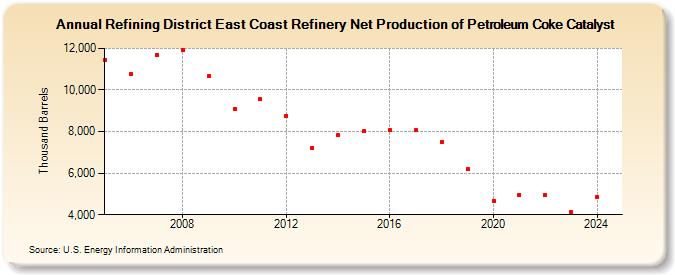
| Refining District East Coast Refinery Net Production of Petroleum Coke Catalyst (Thousand Barrels) | ||||||||
| Decade | Year-0 | Year-1 | Year-2 | Year-3 | Year-4 | Year-5 | Year-6 | Year-7 | Year-8 | Year-9 |
|---|---|---|---|---|---|---|---|---|---|---|
| 2000's | 11,460 | 10,754 | 11,703 | 11,930 | 10,659 | |||||
| 2010's | 9,108 | 9,557 | 8,770 | 7,211 | 7,845 | 8,008 | 8,055 | 8,071 | 7,498 | 6,190 |
| 2020's | 4,666 | 4,961 | 4,959 | 3,654 |
| - = No Data Reported; -- = Not Applicable; NA = Not Available; W = Withheld to avoid disclosure of individual company data. |
| Release Date: 6/28/2024 |
| Next Release Date: 8/30/2024 |