|
Download Data (XLS File) |
|
||||||||
|
||||||||
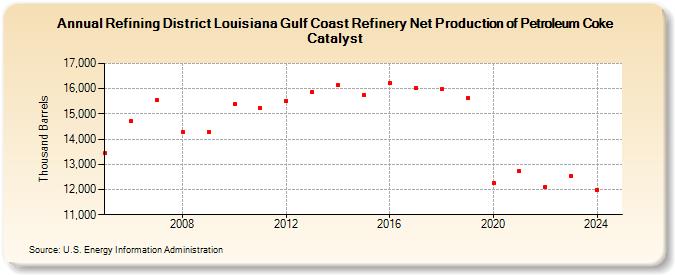
| Refining District Louisiana Gulf Coast Refinery Net Production of Petroleum Coke Catalyst (Thousand Barrels) | ||||||||
| Decade | Year-0 | Year-1 | Year-2 | Year-3 | Year-4 | Year-5 | Year-6 | Year-7 | Year-8 | Year-9 |
|---|---|---|---|---|---|---|---|---|---|---|
| 2000's | 13,429 | 14,706 | 15,545 | 14,263 | 14,291 | |||||
| 2010's | 15,376 | 15,243 | 15,514 | 15,885 | 16,130 | 15,742 | 16,231 | 16,016 | 15,978 | 15,623 |
| 2020's | 12,259 | 12,723 | 12,119 | 12,535 |
| - = No Data Reported; -- = Not Applicable; NA = Not Available; W = Withheld to avoid disclosure of individual company data. |
| Release Date: 6/28/2024 |
| Next Release Date: 8/30/2024 |