|
Download Data (XLS File) |
|
||||||||
|
||||||||
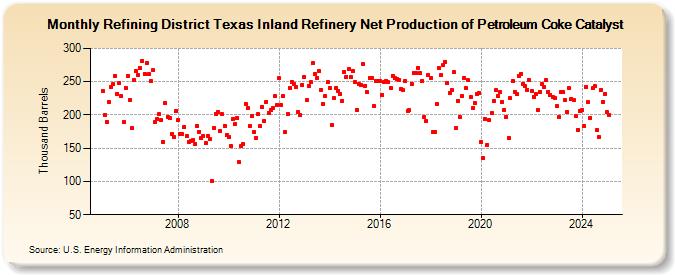
| Refining District Texas Inland Refinery Net Production of Petroleum Coke Catalyst (Thousand Barrels) | ||||||||
| Year | Jan | Feb | Mar | Apr | May | Jun | Jul | Aug | Sep | Oct | Nov | Dec |
|---|---|---|---|---|---|---|---|---|---|---|---|---|
| 2005 | 236 | 200 | 190 | 219 | 242 | 246 | 259 | 232 | 248 | 228 | 189 | 241 |
| 2006 | 259 | 223 | 180 | 252 | 266 | 260 | 270 | 281 | 262 | 278 | 261 | 251 |
| 2007 | 267 | 189 | 194 | 201 | 192 | 159 | 218 | 197 | 196 | 172 | 167 | 206 |
| 2008 | 193 | 171 | 171 | 182 | 168 | 160 | 161 | 163 | 157 | 184 | 175 | 165 |
| 2009 | 169 | 158 | 168 | 164 | 100 | 181 | 202 | 205 | 176 | 201 | 184 | 170 |
| 2010 | 167 | 154 | 194 | 186 | 196 | 129 | 154 | 156 | 217 | 210 | 184 | 198 |
| 2011 | 174 | 166 | 201 | 183 | 212 | 191 | 220 | 203 | 207 | 210 | 228 | 215 |
| 2012 | 255 | 215 | 228 | 174 | 201 | 241 | 250 | 246 | 242 | 205 | 200 | 245 |
| 2013 | 257 | 222 | 244 | 249 | 278 | 262 | 256 | 266 | 238 | 217 | 228 | 249 |
| 2014 | 241 | 185 | 225 | 241 | 236 | 232 | 221 | 265 | 257 | 269 | 257 | 266 |
| 2015 | 250 | 208 | 246 | 245 | 276 | 244 | 234 | 256 | 255 | 214 | 251 | 251 |
| 2016 | 251 | 230 | 250 | 251 | 249 | 241 | 259 | 255 | 254 | 253 | 239 | 237 |
| 2017 | 251 | 206 | 207 | 247 | 263 | 263 | 271 | 263 | 251 | 197 | 191 | 260 |
| 2018 | 256 | 174 | 175 | 217 | 270 | 260 | 275 | 280 | 248 | 233 | 238 | 264 |
| 2019 | 180 | 221 | 197 | 229 | 256 | 240 | 252 | 227 | 210 | 218 | 231 | 233 |
| 2020 | 160 | 135 | 194 | 155 | 192 | 203 | 221 | 237 | 229 | 234 | 220 | 208 |
| 2021 | 197 | 166 | 225 | 251 | 235 | 231 | 259 | 262 | 247 | 243 | 238 | 252 |
| 2022 | 236 | 227 | 231 | 208 | 235 | 247 | 242 | 252 | 235 | 230 | 227 | 226 |
| 2023 | 213 | 197 | 235 | 234 | 222 | 205 | 240 | 224 | 222 | 198 | 178 | 206 |
| 2024 | 207 | |||||||||||
| - = No Data Reported; -- = Not Applicable; NA = Not Available; W = Withheld to avoid disclosure of individual company data. |
| Release Date: 3/29/2024 |
| Next Release Date: 4/30/2024 |