|
Download Data (XLS File) |
|
||||||||
|
||||||||
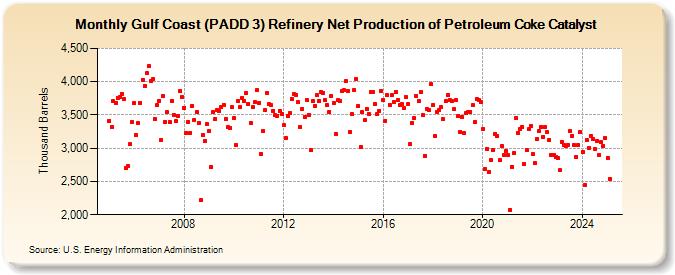
| Gulf Coast (PADD 3) Refinery Net Production of Petroleum Coke Catalyst (Thousand Barrels) | ||||||||
| Year | Jan | Feb | Mar | Apr | May | Jun | Jul | Aug | Sep | Oct | Nov | Dec |
|---|---|---|---|---|---|---|---|---|---|---|---|---|
| 2005 | 3,413 | 3,318 | 3,705 | 3,681 | 3,759 | 3,775 | 3,820 | 3,732 | 2,698 | 2,726 | 3,057 | 3,397 |
| 2006 | 3,673 | 3,193 | 3,376 | 3,686 | 4,030 | 3,940 | 4,124 | 4,228 | 4,008 | 4,041 | 3,442 | 3,651 |
| 2007 | 3,714 | 3,124 | 3,782 | 3,399 | 3,539 | 3,392 | 3,714 | 3,502 | 3,403 | 3,489 | 3,863 | 3,769 |
| 2008 | 3,610 | 3,229 | 3,393 | 3,231 | 3,638 | 3,424 | 3,550 | 3,385 | 2,216 | 3,202 | 3,110 | 3,360 |
| 2009 | 3,265 | 2,714 | 3,540 | 3,439 | 3,576 | 3,559 | 3,614 | 3,654 | 3,442 | 3,312 | 3,309 | 3,615 |
| 2010 | 3,449 | 3,047 | 3,708 | 3,615 | 3,757 | 3,706 | 3,826 | 3,667 | 3,385 | 3,619 | 3,691 | 3,871 |
| 2011 | 3,680 | 2,910 | 3,265 | 3,572 | 3,830 | 3,661 | 3,643 | 3,563 | 3,498 | 3,490 | 3,563 | 3,511 |
| 2012 | 3,342 | 3,149 | 3,486 | 3,526 | 3,737 | 3,811 | 3,804 | 3,689 | 3,318 | 3,591 | 3,472 | 3,729 |
| 2013 | 3,501 | 2,969 | 3,709 | 3,641 | 3,792 | 3,714 | 3,845 | 3,835 | 3,717 | 3,646 | 3,544 | 3,782 |
| 2014 | 3,685 | 3,216 | 3,718 | 3,711 | 3,856 | 3,869 | 4,006 | 3,867 | 3,247 | 3,508 | 3,877 | 4,035 |
| 2015 | 3,637 | 3,015 | 3,548 | 3,419 | 3,596 | 3,514 | 3,838 | 3,848 | 3,665 | 3,507 | 3,561 | 3,865 |
| 2016 | 3,722 | 3,415 | 3,797 | 3,655 | 3,794 | 3,699 | 3,847 | 3,721 | 3,652 | 3,661 | 3,600 | 3,768 |
| 2017 | 3,657 | 3,062 | 3,385 | 3,457 | 3,784 | 3,706 | 3,845 | 3,499 | 2,885 | 3,595 | 3,574 | 3,960 |
| 2018 | 3,653 | 3,177 | 3,548 | 3,572 | 3,613 | 3,433 | 3,705 | 3,799 | 3,721 | 3,704 | 3,585 | 3,722 |
| 2019 | 3,490 | 3,249 | 3,470 | 3,227 | 3,527 | 3,538 | 3,550 | 3,649 | 3,390 | 3,738 | 3,717 | 3,689 |
| 2020 | 3,282 | 2,691 | 2,993 | 2,639 | 2,817 | 2,969 | 3,219 | 3,179 | 2,818 | 3,033 | 2,898 | 2,960 |
| 2021 | 2,894 | 2,076 | 2,724 | 2,928 | 3,454 | 3,234 | 3,286 | 3,321 | 2,757 | 2,971 | 3,284 | 3,338 |
| 2022 | 2,908 | 2,773 | 3,136 | 3,253 | 3,320 | 3,173 | 3,322 | 3,243 | 3,120 | 2,903 | 2,897 | 2,865 |
| 2023 | 2,845 | 2,665 | 3,098 | 3,045 | 3,032 | 3,054 | 3,256 | 3,189 | 3,045 | 2,868 | 3,008 | 3,150 |
| 2024 | 2,946 | |||||||||||
| - = No Data Reported; -- = Not Applicable; NA = Not Available; W = Withheld to avoid disclosure of individual company data. |
| Release Date: 3/29/2024 |
| Next Release Date: 4/30/2024 |