|
Download Data (XLS File) |
|
||||||||
|
||||||||
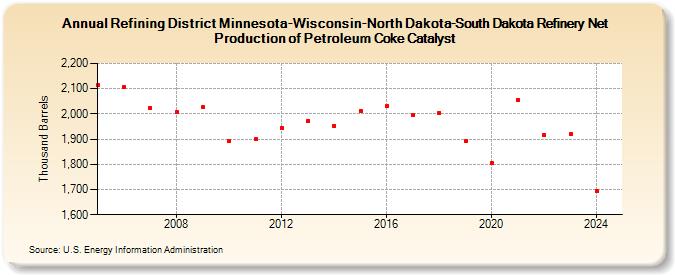
| Refining District Minnesota-Wisconsin-North Dakota-South Dakota Refinery Net Production of Petroleum Coke Catalyst (Thousand Barrels) | ||||||||
| Decade | Year-0 | Year-1 | Year-2 | Year-3 | Year-4 | Year-5 | Year-6 | Year-7 | Year-8 | Year-9 |
|---|---|---|---|---|---|---|---|---|---|---|
| 2000's | 2,113 | 2,105 | 2,024 | 2,009 | 2,027 | |||||
| 2010's | 1,893 | 1,899 | 1,945 | 1,973 | 1,953 | 2,012 | 2,032 | 1,994 | 2,005 | 1,892 |
| 2020's | 1,807 | 2,056 | 1,916 | 1,919 |
| - = No Data Reported; -- = Not Applicable; NA = Not Available; W = Withheld to avoid disclosure of individual company data. |
| Release Date: 3/29/2024 |
| Next Release Date: 8/30/2024 |