|
Download Data (XLS File) |
|
||||||||
|
||||||||
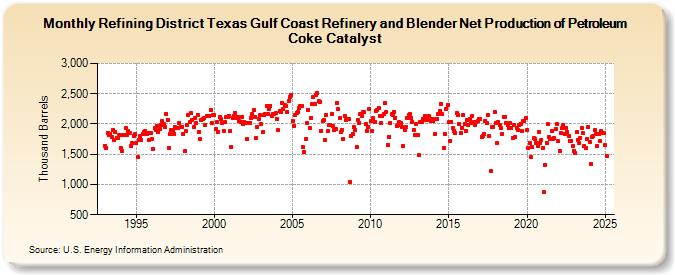
| Refining District Texas Gulf Coast Refinery and Blender Net Production of Petroleum Coke Catalyst (Thousand Barrels) | ||||||||
| Year | Jan | Feb | Mar | Apr | May | Jun | Jul | Aug | Sep | Oct | Nov | Dec |
|---|---|---|---|---|---|---|---|---|---|---|---|---|
| 1993 | 1,641 | 1,606 | 1,855 | 1,821 | 1,835 | 1,790 | 1,901 | 1,740 | 1,868 | 1,776 | 1,770 | 1,814 |
| 1994 | 1,596 | 1,554 | 1,813 | 1,810 | 1,928 | 1,826 | 1,881 | 1,859 | 1,632 | 1,680 | 1,795 | 1,827 |
| 1995 | 1,692 | 1,453 | 1,729 | 1,793 | 1,741 | 1,830 | 1,871 | 1,885 | 1,839 | 1,853 | 1,733 | 1,857 |
| 1996 | 1,749 | 1,580 | 1,929 | 1,905 | 1,972 | 1,865 | 1,915 | 1,987 | 2,047 | 1,997 | 1,943 | 2,170 |
| 1997 | 2,070 | 1,603 | 1,840 | 1,893 | 1,897 | 1,832 | 1,942 | 1,934 | 1,934 | 2,022 | 1,953 | 1,953 |
| 1998 | 1,837 | 1,546 | 1,876 | 1,987 | 2,151 | 2,031 | 2,178 | 2,071 | 1,947 | 2,096 | 2,011 | 2,154 |
| 1999 | 1,869 | 1,744 | 2,059 | 2,075 | 2,092 | 1,989 | 2,129 | 2,133 | 2,124 | 2,227 | 2,016 | 2,141 |
| 2000 | 2,144 | 1,916 | 2,036 | 1,874 | 2,118 | 2,089 | 2,017 | 1,888 | 2,026 | 2,114 | 2,108 | 2,130 |
| 2001 | 1,881 | 1,618 | 2,091 | 2,129 | 2,187 | 2,098 | 2,119 | 2,049 | 2,037 | 2,114 | 2,005 | 2,034 |
| 2002 | 2,012 | 1,756 | 2,015 | 2,008 | 2,098 | 2,168 | 2,229 | 2,117 | 1,776 | 1,943 | 2,080 | 2,150 |
| 2003 | 2,006 | 1,863 | 2,142 | 2,164 | 2,295 | 2,158 | 2,251 | 2,304 | 2,139 | 2,173 | 2,161 | 2,178 |
| 2004 | 2,089 | 1,896 | 2,207 | 2,199 | 2,351 | 2,242 | 2,310 | 2,294 | 2,194 | 2,381 | 2,449 | 2,484 |
| 2005 | 2,051 | 1,973 | 2,154 | 2,181 | 2,195 | 2,259 | 2,299 | 2,304 | 1,620 | 1,535 | 1,756 | 2,009 |
| 2006 | 2,234 | 1,933 | 2,104 | 2,329 | 2,442 | 2,333 | 2,483 | 2,517 | 2,382 | 2,365 | 1,890 | 2,041 |
| 2007 | 2,067 | 1,736 | 2,153 | 1,890 | 1,981 | 1,987 | 2,162 | 1,959 | 1,897 | 1,916 | 2,349 | 2,246 |
| 2008 | 2,094 | 1,873 | 1,902 | 1,757 | 2,132 | 2,073 | 2,080 | 2,079 | 1,049 | 1,796 | 1,836 | 1,952 |
| 2009 | 1,907 | 1,617 | 2,066 | 2,019 | 2,158 | 2,136 | 2,192 | 2,192 | 1,993 | 1,885 | 1,956 | 2,255 |
| 2010 | 2,042 | 1,879 | 2,094 | 2,032 | 2,221 | 2,235 | 2,261 | 2,136 | 2,019 | 2,136 | 2,168 | 2,347 |
| 2011 | 2,204 | 1,654 | 1,791 | 2,013 | 2,158 | 2,143 | 2,204 | 2,107 | 1,972 | 1,991 | 2,025 | 2,014 |
| 2012 | 1,954 | 1,638 | 1,902 | 1,952 | 2,106 | 2,144 | 2,166 | 2,096 | 2,038 | 1,900 | 1,823 | 2,002 |
| 2013 | 1,824 | 1,480 | 2,028 | 2,038 | 2,086 | 2,066 | 2,134 | 2,115 | 2,071 | 2,126 | 2,045 | 2,086 |
| 2014 | 2,042 | 1,830 | 2,087 | 2,089 | 2,164 | 2,214 | 2,335 | 2,160 | 1,603 | 1,829 | 2,254 | 2,314 |
| 2015 | 2,025 | 1,720 | 2,032 | 1,936 | 1,882 | 1,852 | 2,175 | 2,144 | 2,001 | 1,852 | 1,936 | 2,152 |
| 2016 | 1,998 | 1,890 | 2,060 | 1,991 | 2,076 | 2,024 | 2,134 | 2,032 | 1,980 | 2,025 | 2,041 | 2,077 |
| 2017 | 2,077 | 1,784 | 1,802 | 1,838 | 2,056 | 2,021 | 2,142 | 1,802 | 1,219 | 1,955 | 1,953 | 2,198 |
| 2018 | 2,019 | 1,687 | 2,038 | 1,984 | 1,934 | 1,837 | 2,118 | 2,119 | 2,014 | 1,975 | 1,929 | 2,015 |
| 2019 | 1,940 | 1,773 | 1,983 | 1,788 | 1,935 | 1,904 | 1,979 | 2,006 | 1,883 | 2,047 | 2,054 | 2,092 |
| 2020 | 1,898 | 1,598 | 1,688 | 1,450 | 1,616 | 1,760 | 1,749 | 1,690 | 1,634 | 1,870 | 1,688 | 1,732 |
| 2021 | 1,597 | 871 | 1,321 | 1,685 | 1,995 | 1,787 | 1,753 | 1,892 | 1,750 | 1,770 | 1,914 | 2,000 |
| 2022 | 1,711 | 1,560 | 1,849 | 1,940 | 1,985 | 1,836 | 1,937 | 1,863 | 1,809 | 1,713 | 1,723 | 1,634 |
| 2023 | 1,556 | 1,520 | 1,862 | 1,730 | 1,682 | 1,775 | 1,931 | 1,843 | 1,636 | 1,610 | 1,724 | 1,860 |
| 2024 | 1,710 | 1,334 | 1,790 | 1,803 | ||||||||
| - = No Data Reported; -- = Not Applicable; NA = Not Available; W = Withheld to avoid disclosure of individual company data. |
| Release Date: 6/28/2024 |
| Next Release Date: 7/31/2024 |