|
Download Data (XLS File) |
|
||||||||
|
||||||||
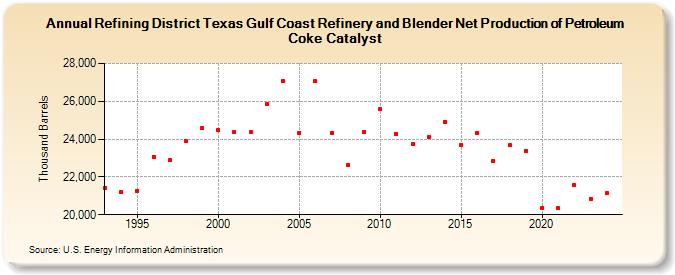
| Refining District Texas Gulf Coast Refinery and Blender Net Production of Petroleum Coke Catalyst (Thousand Barrels) | ||||||||
| Decade | Year-0 | Year-1 | Year-2 | Year-3 | Year-4 | Year-5 | Year-6 | Year-7 | Year-8 | Year-9 |
|---|---|---|---|---|---|---|---|---|---|---|
| 1990's | 21,417 | 21,201 | 21,276 | 23,059 | 22,873 | 23,885 | 24,598 | |||
| 2000's | 24,460 | 24,362 | 24,352 | 25,834 | 27,096 | 24,336 | 27,053 | 24,343 | 22,623 | 24,376 |
| 2010's | 25,570 | 24,276 | 23,721 | 24,099 | 24,921 | 23,707 | 24,328 | 22,847 | 23,669 | 23,384 |
| 2020's | 20,373 | 20,335 | 21,560 | 20,857 |
| - = No Data Reported; -- = Not Applicable; NA = Not Available; W = Withheld to avoid disclosure of individual company data. |
| Release Date: 8/30/2024 |
| Next Release Date: 8/29/2025 |