|
Download Data (XLS File) |
|
||||||||
|
||||||||
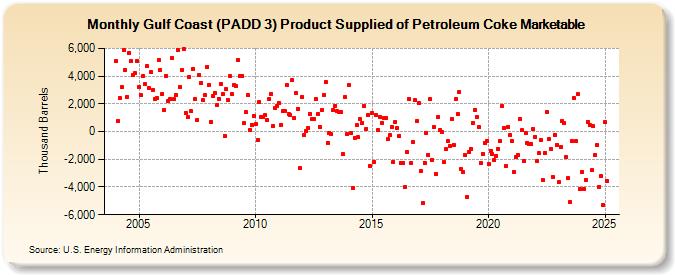
| Gulf Coast (PADD 3) Product Supplied of Petroleum Coke Marketable (Thousand Barrels) | ||||||||
| Year | Jan | Feb | Mar | Apr | May | Jun | Jul | Aug | Sep | Oct | Nov | Dec |
|---|---|---|---|---|---|---|---|---|---|---|---|---|
| 2004 | 5,083 | 756 | 2,412 | 3,179 | 5,853 | 4,463 | 2,503 | 5,687 | 5,057 | 4,107 | 4,215 | 5,099 |
| 2005 | 3,220 | 2,606 | 4,009 | 3,409 | 4,704 | 3,135 | 4,300 | 2,985 | 2,357 | 2,455 | 5,132 | 4,433 |
| 2006 | 2,720 | 1,539 | 4,042 | 2,208 | 2,327 | 5,334 | 2,337 | 2,644 | 5,906 | 3,228 | 4,468 | 5,963 |
| 2007 | 1,359 | 1,055 | 3,967 | 1,456 | 4,521 | 2,315 | 848 | 4,085 | 3,511 | 2,253 | 2,606 | 4,678 |
| 2008 | 3,328 | 724 | 2,545 | 2,776 | 1,889 | 2,383 | 3,454 | 2,678 | -302 | 3,044 | 2,248 | 3,975 |
| 2009 | 2,689 | 3,348 | 3,302 | 5,147 | 4,032 | 4,030 | 593 | 1,403 | 2,622 | 112 | 505 | 1,104 |
| 2010 | 544 | -621 | 2,168 | 1,042 | 1,059 | 1,174 | 846 | 2,365 | 2,719 | 400 | 1,680 | 1,870 |
| 2011 | 2,037 | 508 | 1,480 | 1,482 | 3,329 | 1,250 | 1,183 | 3,688 | 983 | 2,767 | 1,654 | -2,631 |
| 2012 | 2,496 | -264 | 52 | 288 | 1,297 | 883 | 913 | 2,364 | 1,273 | 359 | 1,556 | 2,647 |
| 2013 | 3,600 | -817 | -74 | -197 | 1,589 | 1,862 | 1,472 | 1,412 | 1,410 | -1,620 | 2,504 | -154 |
| 2014 | 3,345 | -134 | -4,075 | -441 | 439 | -415 | 873 | 651 | 1,873 | 194 | 1,180 | -2,453 |
| 2015 | 1,365 | -2,168 | 1,163 | 126 | 1,070 | 649 | 973 | 962 | -556 | -270 | 312 | -2,172 |
| 2016 | 677 | 224 | -307 | -2,275 | -2,235 | -4,002 | -1,468 | 2,340 | -2,235 | -786 | 2,269 | 758 |
| 2017 | 2,040 | -2,839 | -5,185 | -2,233 | -94 | -1,667 | 2,320 | -2,050 | 316 | -3,054 | 1,033 | 127 |
| 2018 | -41 | -2,232 | -1,286 | -666 | -1,057 | 896 | -947 | 2,336 | 1,273 | 2,878 | -2,730 | -2,950 |
| 2019 | -1,724 | -4,720 | -1,486 | -1,287 | 618 | 1,577 | 1,064 | 316 | -2,259 | -1,585 | -806 | -695 |
| 2020 | -2,309 | -1,378 | -1,636 | -2,059 | -1,733 | -1,250 | -697 | 1,826 | 246 | -2,467 | 356 | -224 |
| 2021 | -669 | -2,883 | -1,840 | -1,677 | 890 | 85 | -2,119 | -118 | -817 | -931 | -901 | 181 |
| 2022 | -393 | -2,148 | -1,580 | -633 | -3,519 | -1,527 | 1,422 | -555 | -1,240 | -3,259 | -240 | -964 |
| 2023 | -3,447 | -1,237 | 947 | 816 | -2,018 | -3,988 | -4,320 | -591 | 2,282 | -825 | 2,800 | -4,364 |
| 2024 | -2,904 | -4,121 | -3,463 | 714 | ||||||||
| - = No Data Reported; -- = Not Applicable; NA = Not Available; W = Withheld to avoid disclosure of individual company data. |
| Release Date: 6/28/2024 |
| Next Release Date: 7/31/2024 |