|
Download Data (XLS File) |
|
||||||||
|
||||||||
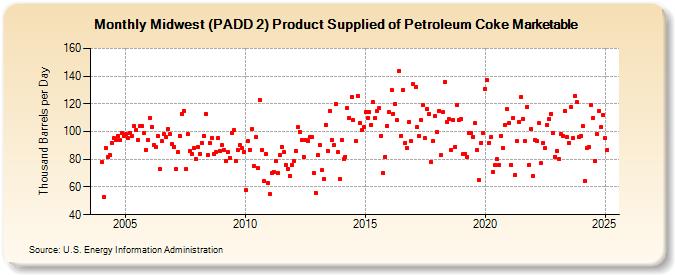
| Midwest (PADD 2) Product Supplied of Petroleum Coke Marketable (Thousand Barrels per Day) | ||||||||
| Year | Jan | Feb | Mar | Apr | May | Jun | Jul | Aug | Sep | Oct | Nov | Dec |
|---|---|---|---|---|---|---|---|---|---|---|---|---|
| 2004 | 78 | 53 | 88 | 82 | 83 | 92 | 95 | 94 | 97 | 94 | 99 | 97 |
| 2005 | 98 | 95 | 99 | 97 | 104 | 101 | 94 | 104 | 104 | 99 | 87 | 94 |
| 2006 | 110 | 103 | 90 | 89 | 97 | 73 | 93 | 98 | 96 | 102 | 98 | 91 |
| 2007 | 89 | 73 | 85 | 97 | 113 | 115 | 73 | 98 | 86 | 84 | 88 | 80 |
| 2008 | 89 | 84 | 92 | 97 | 113 | 83 | 92 | 95 | 84 | 85 | 95 | 86 |
| 2009 | 90 | 87 | 79 | 85 | 81 | 99 | 101 | 79 | 87 | 90 | 88 | 85 |
| 2010 | 58 | 93 | 87 | 102 | 75 | 96 | 74 | 123 | 87 | 64 | 84 | 63 |
| 2011 | 55 | 70 | 71 | 79 | 70 | 83 | 89 | 85 | 76 | 73 | 68 | 76 |
| 2012 | 79 | 86 | 103 | 100 | 94 | 82 | 94 | 93 | 96 | 96 | 70 | 56 |
| 2013 | 83 | 90 | 72 | 66 | 105 | 86 | 115 | 94 | 90 | 120 | 85 | 66 |
| 2014 | 94 | 80 | 82 | 117 | 110 | 125 | 108 | 93 | 126 | 106 | 101 | 103 |
| 2015 | 114 | 110 | 114 | 105 | 121 | 110 | 115 | 117 | 97 | 70 | 82 | 104 |
| 2016 | 114 | 130 | 113 | 120 | 108 | 144 | 97 | 130 | 92 | 88 | 107 | 93 |
| 2017 | 134 | 132 | 103 | 97 | 108 | 119 | 95 | 116 | 113 | 78 | 93 | 111 |
| 2018 | 100 | 115 | 83 | 114 | 136 | 107 | 109 | 87 | 108 | 89 | 119 | 108 |
| 2019 | 109 | 84 | 84 | 82 | 99 | 99 | 96 | 106 | 87 | 65 | 92 | 99 |
| 2020 | 131 | 137 | 92 | 96 | 71 | 76 | 80 | 76 | 97 | 88 | 105 | 116 |
| 2021 | 106 | 76 | 110 | 69 | 93 | 107 | 125 | 109 | 93 | 118 | 76 | 102 |
| 2022 | 68 | 94 | 93 | 106 | 77 | 92 | 88 | 105 | 109 | 113 | 99 | 82 |
| 2023 | 86 | 80 | 98 | 97 | 115 | 96 | 92 | 118 | 95 | 126 | 122 | 96 |
| 2024 | 96 | |||||||||||
| - = No Data Reported; -- = Not Applicable; NA = Not Available; W = Withheld to avoid disclosure of individual company data. |
| Release Date: 3/29/2024 |
| Next Release Date: 4/30/2024 |