|
Download Data (XLS File) |
|
||||||||
|
||||||||
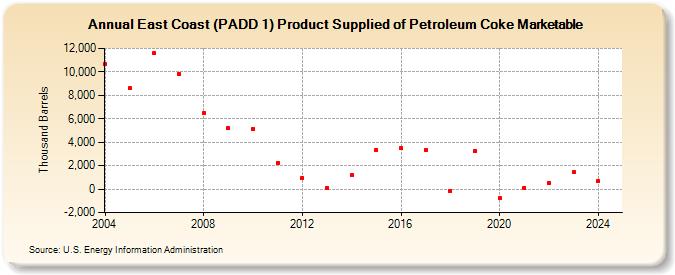
| East Coast (PADD 1) Product Supplied of Petroleum Coke Marketable (Thousand Barrels) | ||||||||
| Decade | Year-0 | Year-1 | Year-2 | Year-3 | Year-4 | Year-5 | Year-6 | Year-7 | Year-8 | Year-9 |
|---|---|---|---|---|---|---|---|---|---|---|
| 2000's | 10,700 | 8,622 | 11,574 | 9,844 | 6,474 | 5,170 | ||||
| 2010's | 5,106 | 2,247 | 964 | 107 | 1,174 | 3,355 | 3,477 | 3,360 | -125 | 3,264 |
| 2020's | -790 | 118 | 541 | 1,582 |
| - = No Data Reported; -- = Not Applicable; NA = Not Available; W = Withheld to avoid disclosure of individual company data. |
| Release Date: 3/29/2024 |
| Next Release Date: 8/30/2024 |