|
Download Data (XLS File) |
|
||||||||
|
||||||||
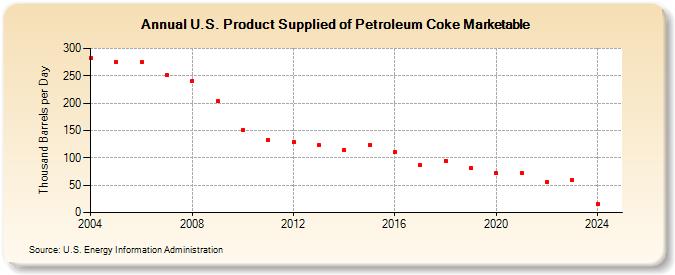
| U.S. Product Supplied of Petroleum Coke Marketable (Thousand Barrels per Day) | ||||||||
| Decade | Year-0 | Year-1 | Year-2 | Year-3 | Year-4 | Year-5 | Year-6 | Year-7 | Year-8 | Year-9 |
|---|---|---|---|---|---|---|---|---|---|---|
| 2000's | 282 | 276 | 276 | 251 | 241 | 203 | ||||
| 2010's | 151 | 133 | 129 | 123 | 114 | 124 | 111 | 86 | 95 | 82 |
| 2020's | 72 | 72 | 55 | 60 | 16 |
| - = No Data Reported; -- = Not Applicable; NA = Not Available; W = Withheld to avoid disclosure of individual company data. |
| Release Date: 6/30/2025 |
| Next Release Date: 8/29/2025 |