|
Download Data (XLS File) |
|
||||||||
|
||||||||
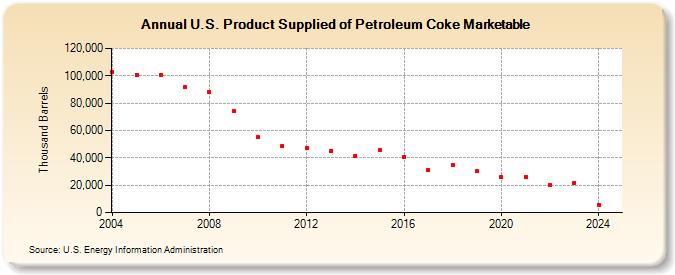
| U.S. Product Supplied of Petroleum Coke Marketable (Thousand Barrels) | ||||||||
| Decade | Year-0 | Year-1 | Year-2 | Year-3 | Year-4 | Year-5 | Year-6 | Year-7 | Year-8 | Year-9 |
|---|---|---|---|---|---|---|---|---|---|---|
| 2000's | 103,101 | 100,824 | 100,575 | 91,493 | 88,249 | 74,031 | ||||
| 2010's | 55,069 | 48,698 | 47,196 | 44,945 | 41,671 | 45,419 | 40,761 | 31,466 | 34,744 | 30,100 |
| 2020's | 26,212 | 26,342 | 20,086 | 21,942 |
| - = No Data Reported; -- = Not Applicable; NA = Not Available; W = Withheld to avoid disclosure of individual company data. |
| Release Date: 3/29/2024 |
| Next Release Date: 8/30/2024 |