|
Download Data (XLS File) |
|
||||||||
|
||||||||
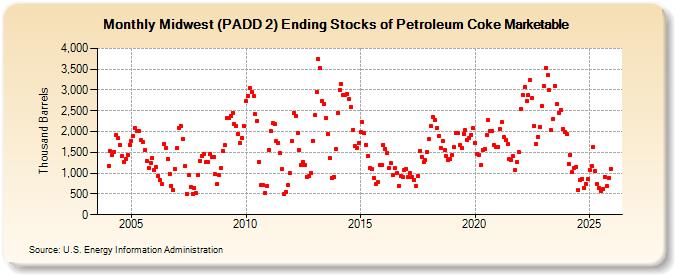
| Midwest (PADD 2) Ending Stocks of Petroleum Coke Marketable (Thousand Barrels) | ||||||||
| Year | Jan | Feb | Mar | Apr | May | Jun | Jul | Aug | Sep | Oct | Nov | Dec |
|---|---|---|---|---|---|---|---|---|---|---|---|---|
| 2004 | 1,181 | 1,523 | 1,436 | 1,513 | 1,912 | 1,836 | 1,685 | 1,422 | 1,269 | 1,340 | 1,447 | 1,684 |
| 2005 | 1,781 | 1,902 | 2,085 | 2,003 | 2,012 | 1,786 | 1,741 | 1,554 | 1,300 | 1,123 | 1,250 | 1,364 |
| 2006 | 1,085 | 1,152 | 924 | 840 | 728 | 1,696 | 1,613 | 1,340 | 980 | 699 | 587 | 1,096 |
| 2007 | 1,598 | 2,081 | 2,134 | 1,831 | 1,170 | 504 | 960 | 655 | 509 | 648 | 520 | 961 |
| 2008 | 1,303 | 1,422 | 1,465 | 1,263 | 1,260 | 1,458 | 1,387 | 1,394 | 968 | 742 | 947 | 1,118 |
| 2009 | 1,524 | 1,667 | 2,324 | 2,321 | 2,378 | 2,450 | 2,184 | 2,130 | 1,943 | 1,729 | 1,849 | 2,126 |
| 2010 | 2,725 | 2,856 | 3,045 | 2,954 | 2,844 | 2,411 | 2,256 | 1,263 | 716 | 707 | 520 | 701 |
| 2011 | 1,558 | 2,006 | 2,194 | 2,180 | 1,761 | 1,735 | 1,473 | 1,098 | 489 | 554 | 707 | 993 |
| 2012 | 1,764 | 2,455 | 2,376 | 1,970 | 1,546 | 1,189 | 1,272 | 1,186 | 915 | 921 | 1,001 | 1,783 |
| 2013 | 2,392 | 2,953 | 3,750 | 3,526 | 2,729 | 2,668 | 2,329 | 1,947 | 1,353 | 873 | 918 | 1,584 |
| 2014 | 2,457 | 3,001 | 3,153 | 2,884 | 2,872 | 2,904 | 2,791 | 2,598 | 2,045 | 1,647 | 1,611 | 1,714 |
| 2015 | 1,982 | 2,229 | 1,960 | 1,685 | 1,420 | 1,116 | 1,088 | 891 | 746 | 778 | 1,194 | 1,196 |
| 2016 | 1,684 | 1,587 | 1,484 | 1,119 | 1,235 | 946 | 1,118 | 1,003 | 701 | 921 | 897 | 1,078 |
| 2017 | 1,101 | 898 | 992 | 901 | 833 | 697 | 936 | 1,528 | 1,397 | 1,258 | 1,308 | 1,517 |
| 2018 | 1,822 | 2,128 | 2,351 | 2,271 | 2,088 | 1,889 | 1,608 | 1,781 | 1,546 | 1,401 | 1,322 | 1,338 |
| 2019 | 1,426 | 1,621 | 1,957 | 1,957 | 1,677 | 1,612 | 1,942 | 2,027 | 1,791 | 1,838 | 1,929 | 2,076 |
| 2020 | 1,723 | 1,462 | 1,445 | 1,193 | 1,559 | 1,574 | 1,908 | 2,269 | 2,003 | 2,015 | 1,673 | 1,635 |
| 2021 | 1,635 | 2,061 | 2,232 | 1,878 | 1,791 | 1,695 | 1,336 | 1,311 | 1,410 | 1,070 | 1,275 | 1,502 |
| 2022 | 2,548 | 2,884 | 3,068 | 2,732 | 2,875 | 3,235 | 2,797 | 2,142 | 1,712 | 1,881 | 2,106 | 2,619 |
| 2023 | 3,091 | 3,530 | 3,360 | 3,004 | 2,027 | 2,299 | 3,097 | 2,668 | 2,450 | 2,520 | 2,072 | 1,978 |
| 2024 | 1,931 | 1,229 | 1,445 | 1,016 | ||||||||
| - = No Data Reported; -- = Not Applicable; NA = Not Available; W = Withheld to avoid disclosure of individual company data. |
| Release Date: 6/28/2024 |
| Next Release Date: 7/31/2024 |