|
Download Data (XLS File) |
|
||||||||
|
||||||||
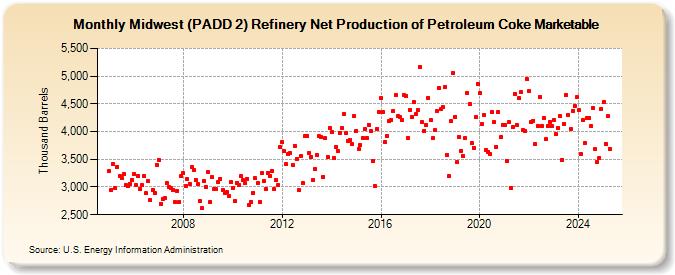
| Midwest (PADD 2) Refinery Net Production of Petroleum Coke Marketable (Thousand Barrels) | ||||||||
| Year | Jan | Feb | Mar | Apr | May | Jun | Jul | Aug | Sep | Oct | Nov | Dec |
|---|---|---|---|---|---|---|---|---|---|---|---|---|
| 2005 | 3,286 | 2,952 | 3,409 | 2,984 | 3,368 | 3,192 | 3,169 | 3,229 | 3,030 | 3,010 | 3,059 | 3,130 |
| 2006 | 3,234 | 3,039 | 3,204 | 2,968 | 3,029 | 3,193 | 2,883 | 3,101 | 2,758 | 2,946 | 2,896 | 3,403 |
| 2007 | 3,495 | 2,699 | 2,775 | 2,794 | 3,064 | 2,997 | 2,977 | 2,951 | 2,725 | 2,929 | 2,732 | 3,203 |
| 2008 | 3,248 | 3,018 | 3,136 | 3,058 | 3,352 | 3,315 | 3,135 | 3,048 | 2,740 | 2,621 | 3,105 | 3,003 |
| 2009 | 3,272 | 2,735 | 3,179 | 2,969 | 2,956 | 3,084 | 3,151 | 2,948 | 2,889 | 2,901 | 2,840 | 3,085 |
| 2010 | 2,989 | 2,747 | 3,080 | 3,042 | 3,196 | 3,124 | 3,067 | 3,149 | 2,675 | 2,732 | 2,889 | 3,155 |
| 2011 | 3,064 | 2,728 | 3,246 | 3,103 | 2,961 | 3,261 | 3,202 | 3,287 | 2,960 | 3,118 | 3,033 | 3,714 |
| 2012 | 3,807 | 3,645 | 3,410 | 3,599 | 3,607 | 3,397 | 3,744 | 3,509 | 2,940 | 3,567 | 3,072 | 3,914 |
| 2013 | 3,918 | 3,606 | 3,539 | 3,120 | 3,320 | 3,579 | 3,914 | 3,895 | 3,188 | 3,881 | 3,545 | 4,068 |
| 2014 | 3,983 | 3,530 | 3,713 | 3,652 | 3,981 | 4,073 | 4,317 | 3,967 | 3,833 | 3,853 | 3,768 | 4,275 |
| 2015 | 4,015 | 3,684 | 3,753 | 3,887 | 4,039 | 3,886 | 4,124 | 4,012 | 3,464 | 3,011 | 4,047 | 4,348 |
| 2016 | 4,608 | 4,347 | 3,803 | 3,913 | 4,182 | 4,217 | 4,373 | 4,652 | 4,275 | 4,263 | 4,212 | 4,655 |
| 2017 | 4,642 | 3,885 | 4,397 | 4,267 | 4,534 | 4,319 | 4,386 | 5,170 | 4,165 | 4,018 | 4,116 | 4,603 |
| 2018 | 4,201 | 3,882 | 4,020 | 4,370 | 4,786 | 4,401 | 4,436 | 4,807 | 3,583 | 3,198 | 4,183 | 5,050 |
| 2019 | 4,269 | 3,446 | 3,906 | 3,657 | 3,561 | 3,881 | 4,693 | 4,496 | 3,792 | 3,709 | 4,257 | 4,851 |
| 2020 | 4,695 | 4,128 | 4,299 | 3,669 | 3,633 | 3,589 | 4,352 | 4,171 | 3,730 | 4,356 | 3,896 | 4,119 |
| 2021 | 4,112 | 3,471 | 4,167 | 2,990 | 4,078 | 4,679 | 4,126 | 4,597 | 4,711 | 4,031 | 4,013 | 4,939 |
| 2022 | 4,729 | 4,165 | 4,197 | 3,779 | 4,101 | 4,632 | 4,100 | 4,247 | 3,860 | 4,102 | 4,181 | 4,099 |
| 2023 | 4,203 | 3,948 | 4,063 | 4,287 | 3,492 | 4,133 | 4,659 | 4,296 | 4,039 | 4,371 | 4,463 | 4,617 |
| 2024 | 4,397 | |||||||||||
| - = No Data Reported; -- = Not Applicable; NA = Not Available; W = Withheld to avoid disclosure of individual company data. |
| Release Date: 3/29/2024 |
| Next Release Date: 4/30/2024 |