|
Download Data (XLS File) |
|
||||||||
|
||||||||
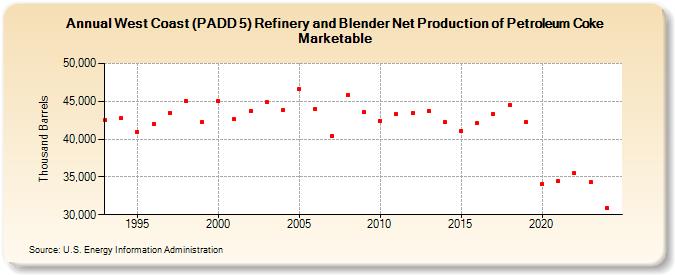
| West Coast (PADD 5) Refinery and Blender Net Production of Petroleum Coke Marketable (Thousand Barrels) | ||||||||
| Decade | Year-0 | Year-1 | Year-2 | Year-3 | Year-4 | Year-5 | Year-6 | Year-7 | Year-8 | Year-9 |
|---|---|---|---|---|---|---|---|---|---|---|
| 1990's | 42,467 | 42,774 | 40,990 | 42,049 | 43,504 | 45,028 | 42,241 | |||
| 2000's | 45,023 | 42,619 | 43,720 | 44,852 | 43,791 | 46,616 | 43,981 | 40,432 | 45,801 | 43,560 |
| 2010's | 42,455 | 43,253 | 43,479 | 43,752 | 42,205 | 41,109 | 42,117 | 43,351 | 44,541 | 42,282 |
| 2020's | 34,088 | 34,441 | 35,456 | 34,318 |
| - = No Data Reported; -- = Not Applicable; NA = Not Available; W = Withheld to avoid disclosure of individual company data. |
| Release Date: 3/29/2024 |
| Next Release Date: 8/30/2024 |