|
Download Data (XLS File) |
|
||||||||
|
||||||||
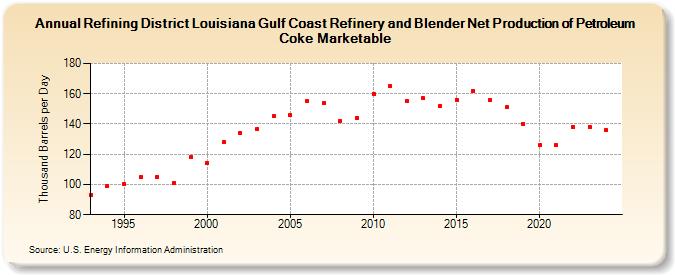
| Refining District Louisiana Gulf Coast Refinery and Blender Net Production of Petroleum Coke Marketable (Thousand Barrels per Day) | ||||||||
| Decade | Year-0 | Year-1 | Year-2 | Year-3 | Year-4 | Year-5 | Year-6 | Year-7 | Year-8 | Year-9 |
|---|---|---|---|---|---|---|---|---|---|---|
| 1990's | 93 | 99 | 100 | 105 | 105 | 101 | 118 | |||
| 2000's | 114 | 128 | 134 | 137 | 145 | 146 | 155 | 154 | 142 | 144 |
| 2010's | 160 | 165 | 155 | 157 | 152 | 156 | 162 | 156 | 151 | 140 |
| 2020's | 126 | 126 | 138 | 138 |
| - = No Data Reported; -- = Not Applicable; NA = Not Available; W = Withheld to avoid disclosure of individual company data. |
| Release Date: 8/30/2024 |
| Next Release Date: 8/29/2025 |