|
Download Data (XLS File) |
|
||||||||
|
||||||||
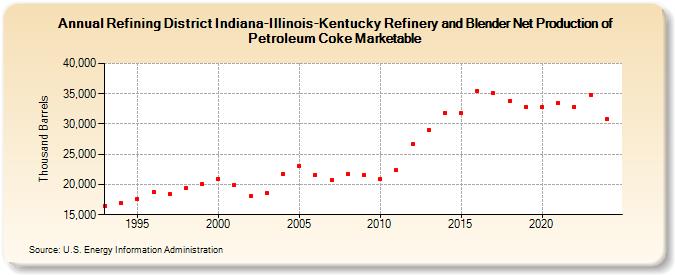
| Refining District Indiana-Illinois-Kentucky Refinery and Blender Net Production of Petroleum Coke Marketable (Thousand Barrels) | ||||||||
| Decade | Year-0 | Year-1 | Year-2 | Year-3 | Year-4 | Year-5 | Year-6 | Year-7 | Year-8 | Year-9 |
|---|---|---|---|---|---|---|---|---|---|---|
| 1990's | 16,485 | 16,861 | 17,668 | 18,816 | 18,450 | 19,450 | 20,091 | |||
| 2000's | 20,976 | 19,939 | 18,031 | 18,550 | 21,731 | 23,095 | 21,635 | 20,700 | 21,691 | 21,578 |
| 2010's | 20,873 | 22,334 | 26,640 | 28,992 | 31,883 | 31,732 | 35,529 | 35,097 | 33,803 | 32,859 |
| 2020's | 32,817 | 33,512 | 32,888 | 34,863 | 30,787 |
| - = No Data Reported; -- = Not Applicable; NA = Not Available; W = Withheld to avoid disclosure of individual company data. |
| Release Date: 6/30/2025 |
| Next Release Date: 8/29/2025 |