|
Download Data (XLS File) |
|
||||||||
|
||||||||
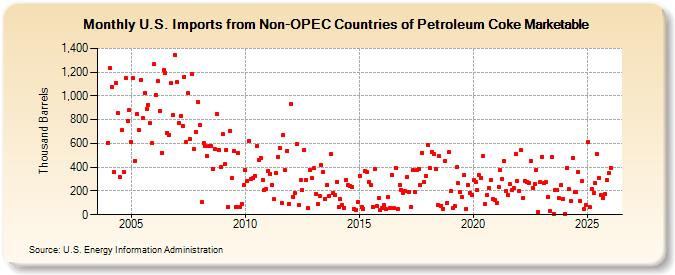
| U.S. Imports from Non-OPEC Countries of Petroleum Coke Marketable (Thousand Barrels) | ||||||||
| Year | Jan | Feb | Mar | Apr | May | Jun | Jul | Aug | Sep | Oct | Nov | Dec |
|---|---|---|---|---|---|---|---|---|---|---|---|---|
| 2004 | 605 | 1,233 | 1,074 | 359 | 1,112 | 852 | 319 | 713 | 362 | 1,153 | 788 | 879 |
| 2005 | 609 | 1,148 | 455 | 850 | 711 | 1,131 | 810 | 1,026 | 888 | 926 | 768 | 601 |
| 2006 | 1,265 | 1,005 | 1,123 | 872 | 522 | 1,217 | 1,193 | 689 | 673 | 1,105 | 839 | 1,344 |
| 2007 | 1,113 | 775 | 830 | 747 | 1,162 | 610 | 1,022 | 635 | 1,184 | 552 | 699 | 952 |
| 2008 | 753 | 103 | 600 | 576 | 491 | 575 | 576 | 387 | 550 | 848 | 548 | 398 |
| 2009 | 677 | 423 | 548 | 64 | 707 | 310 | 533 | 69 | 519 | 66 | 91 | 250 |
| 2010 | 373 | 284 | 622 | 302 | 306 | 330 | 578 | 457 | 476 | 296 | 209 | 217 |
| 2011 | 369 | 345 | 253 | 130 | 349 | 486 | 563 | 99 | 673 | 374 | 537 | 92 |
| 2012 | 931 | 151 | 181 | 594 | 80 | 288 | 204 | 545 | 290 | 53 | 377 | 309 |
| 2013 | 390 | 175 | 91 | 157 | 417 | 363 | 133 | 248 | 158 | 507 | 186 | 165 |
| 2014 | 279 | 61 | 129 | 83 | 58 | 296 | 247 | 244 | 234 | 52 | 43 | 108 |
| 2015 | 328 | 62 | 52 | 364 | 357 | 277 | 250 | 63 | 384 | 73 | 138 | 37 |
| 2016 | 57 | 79 | 46 | 146 | 58 | 336 | 53 | 394 | 52 | 254 | 204 | 186 |
| 2017 | 196 | 318 | 194 | 64 | 373 | 190 | 375 | 384 | 252 | 522 | 272 | 330 |
| 2018 | 583 | 390 | 529 | 514 | 386 | 79 | 492 | 74 | 51 | 453 | 99 | 525 |
| 2019 | 202 | 53 | 71 | 398 | 266 | 189 | 150 | 333 | 49 | 250 | 185 | 166 |
| 2020 | 292 | 274 | 211 | 331 | 309 | 492 | 94 | 167 | 223 | 290 | 133 | 124 |
| 2021 | 100 | 236 | 373 | 303 | 451 | 203 | 166 | 255 | 208 | 228 | 510 | 282 |
| 2022 | 201 | 542 | 142 | 280 | 275 | 266 | 448 | 227 | 258 | 377 | 24 | 274 |
| 2023 | 490 | 271 | 272 | 151 | 32 | 485 | 9 | 204 | 206 | 137 | 253 | 132 |
| 2024 | 10 | |||||||||||
| - = No Data Reported; -- = Not Applicable; NA = Not Available; W = Withheld to avoid disclosure of individual company data. |
| Release Date: 3/29/2024 |
| Next Release Date: 4/30/2024 |