|
Download Data (XLS File) |
|
||||||||
|
||||||||
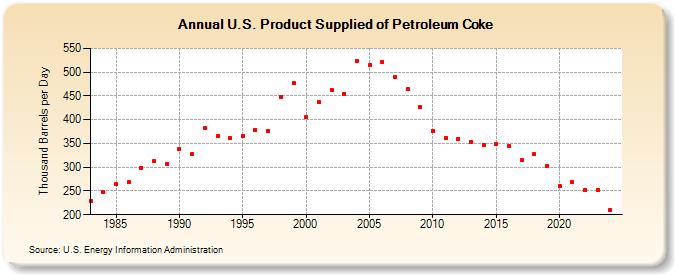
| U.S. Product Supplied of Petroleum Coke (Thousand Barrels per Day) | ||||||||
| Decade | Year-0 | Year-1 | Year-2 | Year-3 | Year-4 | Year-5 | Year-6 | Year-7 | Year-8 | Year-9 |
|---|---|---|---|---|---|---|---|---|---|---|
| 1980's | 229 | 247 | 264 | 268 | 299 | 312 | 307 | |||
| 1990's | 339 | 328 | 382 | 366 | 361 | 365 | 379 | 377 | 447 | 477 |
| 2000's | 406 | 437 | 463 | 455 | 524 | 515 | 522 | 490 | 464 | 427 |
| 2010's | 376 | 361 | 360 | 354 | 347 | 349 | 345 | 316 | 327 | 303 |
| 2020's | 260 | 269 | 253 | 253 |
| - = No Data Reported; -- = Not Applicable; NA = Not Available; W = Withheld to avoid disclosure of individual company data. |
| Release Date: 8/30/2024 |
| Next Release Date: 8/29/2025 |