|
Download Data (XLS File) |
|
||||||||
|
||||||||
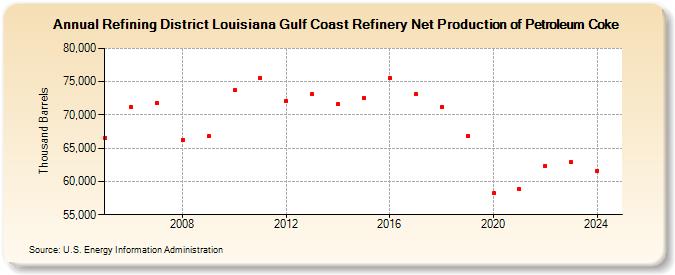
| Refining District Louisiana Gulf Coast Refinery Net Production of Petroleum Coke (Thousand Barrels) | ||||||||
| Decade | Year-0 | Year-1 | Year-2 | Year-3 | Year-4 | Year-5 | Year-6 | Year-7 | Year-8 | Year-9 |
|---|---|---|---|---|---|---|---|---|---|---|
| 2000's | 66,572 | 71,199 | 71,811 | 66,277 | 66,777 | |||||
| 2010's | 73,682 | 75,606 | 72,101 | 73,084 | 71,610 | 72,552 | 75,549 | 73,105 | 71,197 | 66,889 |
| 2020's | 58,207 | 58,799 | 62,342 | 63,113 |
| - = No Data Reported; -- = Not Applicable; NA = Not Available; W = Withheld to avoid disclosure of individual company data. |
| Release Date: 6/28/2024 |
| Next Release Date: 8/30/2024 |