|
Download Data (XLS File) |
|
||||||||
|
||||||||
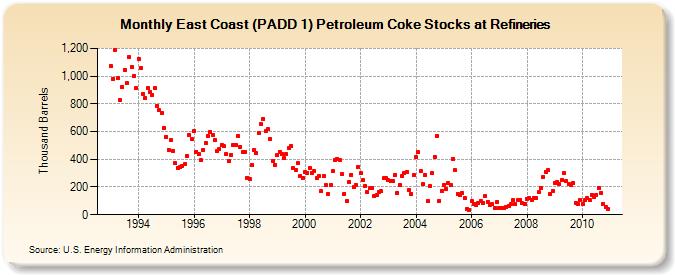
| East Coast (PADD 1) Petroleum Coke Stocks at Refineries (Thousand Barrels) | ||||||||
| Year | Jan | Feb | Mar | Apr | May | Jun | Jul | Aug | Sep | Oct | Nov | Dec |
|---|---|---|---|---|---|---|---|---|---|---|---|---|
| 1993 | 1,072 | 981 | 1,189 | 983 | 826 | 924 | 1,047 | 948 | 1,137 | 1,069 | 1,004 | 911 |
| 1994 | 1,124 | 1,061 | 874 | 842 | 914 | 884 | 863 | 912 | 784 | 752 | 734 | 627 |
| 1995 | 561 | 470 | 536 | 460 | 371 | 339 | 342 | 354 | 363 | 424 | 575 | 545 |
| 1996 | 602 | 456 | 435 | 392 | 468 | 517 | 570 | 600 | 572 | 539 | 461 | 473 |
| 1997 | 503 | 493 | 437 | 390 | 433 | 506 | 505 | 571 | 491 | 449 | 453 | 267 |
| 1998 | 258 | 361 | 465 | 445 | 592 | 653 | 691 | 601 | 616 | 548 | 387 | 361 |
| 1999 | 428 | 454 | 441 | 407 | 437 | 480 | 493 | 334 | 325 | 373 | 279 | 266 |
| 2000 | 308 | 304 | 335 | 303 | 316 | 264 | 281 | 168 | 279 | 211 | 151 | 214 |
| 2001 | 312 | 395 | 405 | 393 | 293 | 153 | 98 | 239 | 289 | 197 | 217 | 344 |
| 2002 | 299 | 247 | 207 | 164 | 190 | 193 | 132 | 144 | 163 | 169 | 262 | 265 |
| 2003 | 248 | 244 | 245 | 290 | 159 | 216 | 282 | 300 | 309 | 177 | 152 | 286 |
| 2004 | 417 | 450 | 312 | 218 | 289 | 98 | 207 | 302 | 419 | 570 | 102 | 173 |
| 2005 | 216 | 189 | 227 | 213 | 404 | 320 | 151 | 139 | 158 | 122 | 42 | 34 |
| 2006 | 98 | 80 | 71 | 81 | 99 | 87 | 135 | 94 | 73 | 74 | 48 | 90 |
| 2007 | 46 | 50 | 46 | 58 | 63 | 76 | 106 | 74 | 106 | 108 | 82 | 80 |
| 2008 | 116 | 121 | 105 | 124 | 121 | 163 | 195 | 274 | 309 | 320 | 151 | 171 |
| 2009 | 231 | 239 | 218 | 250 | 299 | 243 | 222 | 214 | 228 | 87 | 80 | 108 |
| 2010 | 76 | 105 | 117 | 108 | 145 | 127 | 145 | 195 | 157 | 78 | 57 | 43 |
| - = No Data Reported; -- = Not Applicable; NA = Not Available; W = Withheld to avoid disclosure of individual company data. |
| Release Date: 6/28/2024 |
| Next Release Date: 7/31/2024 |