|
Download Data (XLS File) |
|
||||||||
|
||||||||
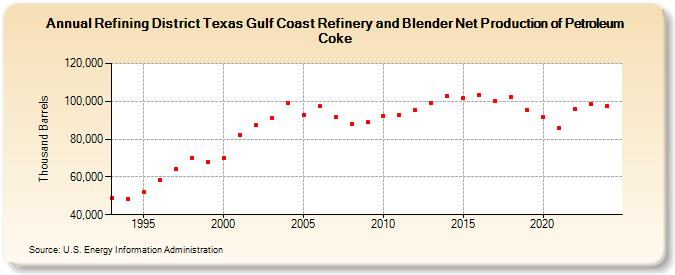
| Refining District Texas Gulf Coast Refinery and Blender Net Production of Petroleum Coke (Thousand Barrels) | ||||||||
| Decade | Year-0 | Year-1 | Year-2 | Year-3 | Year-4 | Year-5 | Year-6 | Year-7 | Year-8 | Year-9 |
|---|---|---|---|---|---|---|---|---|---|---|
| 1990's | 48,752 | 48,208 | 51,877 | 58,495 | 64,247 | 70,038 | 68,114 | |||
| 2000's | 69,910 | 81,919 | 87,273 | 91,268 | 99,257 | 92,896 | 97,372 | 91,536 | 88,189 | 88,863 |
| 2010's | 92,007 | 92,921 | 95,435 | 99,284 | 102,643 | 101,860 | 103,590 | 100,121 | 102,374 | 95,385 |
| 2020's | 91,537 | 85,782 | 95,863 | 97,984 |
| - = No Data Reported; -- = Not Applicable; NA = Not Available; W = Withheld to avoid disclosure of individual company data. |
| Release Date: 3/29/2024 |
| Next Release Date: 8/30/2024 |