|
Download Data (XLS File) |
|
||||||||
|
||||||||
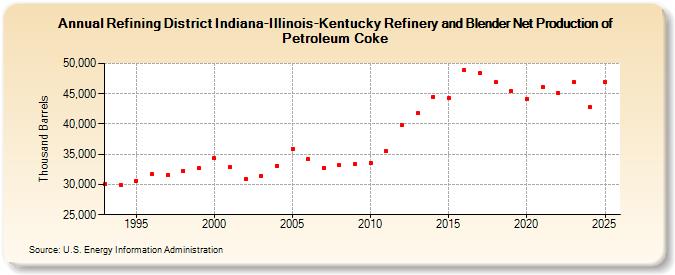
| Refining District Indiana-Illinois-Kentucky Refinery and Blender Net Production of Petroleum Coke (Thousand Barrels) | ||||||||
| Decade | Year-0 | Year-1 | Year-2 | Year-3 | Year-4 | Year-5 | Year-6 | Year-7 | Year-8 | Year-9 |
|---|---|---|---|---|---|---|---|---|---|---|
| 1990's | 30,030 | 29,962 | 30,621 | 31,681 | 31,499 | 32,297 | 32,663 | |||
| 2000's | 34,293 | 32,871 | 30,928 | 31,455 | 33,105 | 35,892 | 34,150 | 32,797 | 33,162 | 33,324 |
| 2010's | 33,613 | 35,513 | 39,788 | 41,766 | 44,533 | 44,275 | 48,911 | 48,356 | 46,934 | 45,397 |
| 2020's | 44,066 | 46,114 | 45,086 | 46,975 |
| - = No Data Reported; -- = Not Applicable; NA = Not Available; W = Withheld to avoid disclosure of individual company data. |
| Release Date: 8/30/2024 |
| Next Release Date: 8/29/2025 |