|
Download Data (XLS File) |
|
||||||||
|
||||||||
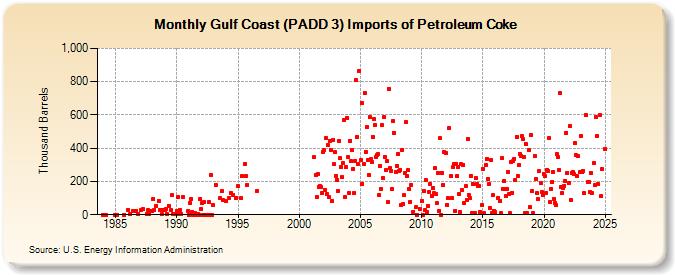
| Gulf Coast (PADD 3) Imports of Petroleum Coke (Thousand Barrels) | ||||||||
| Year | Jan | Feb | Mar | Apr | May | Jun | Jul | Aug | Sep | Oct | Nov | Dec |
|---|---|---|---|---|---|---|---|---|---|---|---|---|
| 1984 | 0 | 0 | 0 | |||||||||
| 1985 | 0 | 0 | ||||||||||
| 1986 | 31 | 3 | 22 | 24 | 4 | |||||||
| 1987 | 30 | 34 | 2 | 29 | 6 | 25 | ||||||
| 1988 | 20 | 95 | 30 | 54 | 84 | 30 | 2 | 30 | ||||
| 1989 | 27 | 33 | 5 | 54 | 28 | 116 | 5 | 5 | ||||
| 1990 | 23 | 104 | 4 | 30 | 5 | 107 | 25 | |||||
| 1991 | 0 | 71 | 95 | 18 | 0 | 0 | 9 | 0 | 0 | 7 | 0 | 95 |
| 1992 | 33 | 70 | 0 | 76 | 0 | 0 | 0 | 75 | 0 | 240 | 0 | 58 |
| 1993 | 181 | 98 | 143 | 90 | ||||||||
| 1994 | 80 | 100 | 131 | 121 | 98 | |||||||
| 1995 | 170 | 100 | 231 | 307 | 234 | 179 | ||||||
| 1996 | 143 | |||||||||||
| 2001 | 344 | 236 | 106 | 243 | 167 | 175 | 167 | 128 | 380 | |||
| 2002 | 387 | 151 | 460 | 125 | 419 | 105 | 445 | 391 | 80 | 450 | 303 | 375 |
| 2003 | 234 | 209 | 143 | 446 | 339 | 286 | 228 | 308 | 570 | 106 | 285 | 584 |
| 2004 | 348 | 131 | 445 | 321 | 391 | 277 | 131 | 325 | 808 | 467 | 305 | 865 |
| 2005 | 326 | 674 | 185 | 307 | 733 | 378 | 526 | 329 | 241 | 585 | 333 | 317 |
| 2006 | 470 | 577 | 540 | 349 | 357 | 364 | 119 | 294 | 157 | 538 | 220 | 586 |
| 2007 | 349 | 268 | 323 | 74 | 756 | 278 | 265 | 154 | 562 | 494 | 259 | |
| 2008 | 294 | 368 | 260 | 271 | 58 | 391 | 66 | 117 | 251 | 556 | 232 | 266 |
| 2009 | 152 | 79 | 181 | 18 | 44 | 1 | 37 | |||||
| 2010 | 85 | 1 | 142 | 28 | 210 | 15 | 51 | 139 | 182 | 115 | 163 | |
| 2011 | 128 | 278 | 126 | 69 | 250 | 23 | 461 | 1 | 253 | 176 | 379 | |
| 2012 | 371 | 60 | 98 | 520 | 233 | 101 | 288 | 305 | 25 | 307 | 232 | |
| 2013 | 289 | 127 | 15 | 303 | 148 | 300 | 72 | 171 | 91 | 458 | 121 | 102 |
| 2014 | 235 | 8 | 185 | 12 | 8 | 221 | 182 | 175 | 171 | 17 | 60 | |
| 2015 | 275 | 8 | 301 | 337 | 215 | 186 | 41 | 330 | 8 | 118 | 24 | |
| 2016 | 14 | 103 | 84 | 8 | 340 | 154 | 204 | 156 | 113 | |||
| 2017 | 155 | 259 | 124 | 8 | 317 | 133 | 324 | 337 | 208 | 469 | 234 | 296 |
| 2018 | 366 | 355 | 472 | 456 | 344 | 8 | 427 | 8 | 387 | 45 | 480 | |
| 2019 | 142 | 8 | 352 | 216 | 132 | 94 | 262 | 188 | 138 | 120 | ||
| 2020 | 246 | 230 | 132 | 271 | 265 | 462 | 77 | 155 | 199 | 259 | 96 | 69 |
| 2021 | 56 | 363 | 345 | 269 | 731 | 168 | 132 | 161 | 175 | 203 | 493 | 253 |
| 2022 | 190 | 533 | 91 | 251 | 258 | 245 | 429 | 357 | 231 | 355 | 256 | |
| 2023 | 476 | 257 | 264 | 129 | 601 | 194 | 199 | 134 | 252 | 128 | ||
| 2024 | 311 | 177 | 587 | |||||||||
| - = No Data Reported; -- = Not Applicable; NA = Not Available; W = Withheld to avoid disclosure of individual company data. |
| Release Date: 6/28/2024 |
| Next Release Date: 7/31/2024 |