|
Download Data (XLS File) |
|
||||||||
|
||||||||
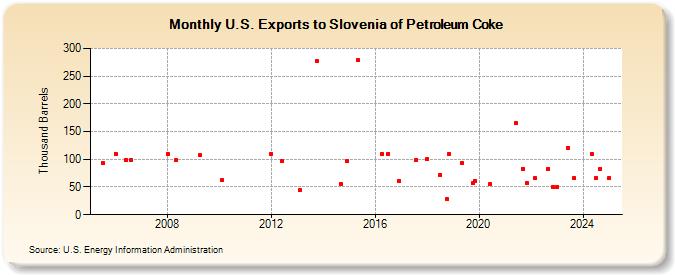
| U.S. Exports to Slovenia of Petroleum Coke (Thousand Barrels) | ||||||||
| Year | Jan | Feb | Mar | Apr | May | Jun | Jul | Aug | Sep | Oct | Nov | Dec |
|---|---|---|---|---|---|---|---|---|---|---|---|---|
| 2005 | 94 | |||||||||||
| 2006 | 110 | 99 | 99 | |||||||||
| 2008 | 110 | 99 | ||||||||||
| 2009 | 107 | |||||||||||
| 2010 | 63 | |||||||||||
| 2012 | 110 | 96 | ||||||||||
| 2013 | 44 | 277 | ||||||||||
| 2014 | 56 | 96 | ||||||||||
| 2015 | 279 | |||||||||||
| 2016 | 110 | 110 | 61 | |||||||||
| 2017 | 99 | |||||||||||
| 2018 | 100 | 72 | 28 | 110 | ||||||||
| 2019 | 94 | 57 | 61 | |||||||||
| 2020 | 55 | |||||||||||
| 2021 | 165 | 83 | 57 | |||||||||
| 2022 | 66 | 83 | 50 | |||||||||
| 2023 | 50 | 121 | 66 | |||||||||
| - = No Data Reported; -- = Not Applicable; NA = Not Available; W = Withheld to avoid disclosure of individual company data. |
| Release Date: 3/29/2024 |
| Next Release Date: 4/30/2024 |