|
Download Data (XLS File) |
|
||||||||
|
||||||||
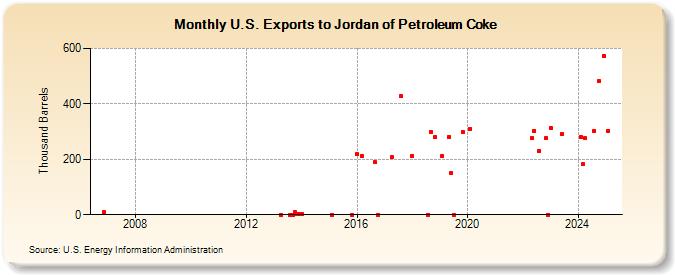
| U.S. Exports to Jordan of Petroleum Coke (Thousand Barrels) | ||||||||
| Year | Jan | Feb | Mar | Apr | May | Jun | Jul | Aug | Sep | Oct | Nov | Dec |
|---|---|---|---|---|---|---|---|---|---|---|---|---|
| 2006 | 9 | |||||||||||
| 2013 | 0 | 0 | 0 | 8 | 4 | 3 | ||||||
| 2014 | 4 | |||||||||||
| 2015 | 0 | 0 | ||||||||||
| 2016 | 218 | 212 | 189 | 0 | ||||||||
| 2017 | 208 | 428 | ||||||||||
| 2018 | 211 | 0 | 299 | 280 | ||||||||
| 2019 | 212 | 282 | 150 | 0 | 297 | |||||||
| 2020 | 311 | |||||||||||
| 2022 | 275 | 303 | 229 | 275 | 0 | |||||||
| 2023 | 292 | |||||||||||
| 2024 | 282 | |||||||||||
| - = No Data Reported; -- = Not Applicable; NA = Not Available; W = Withheld to avoid disclosure of individual company data. |
| Release Date: 4/30/2024 |
| Next Release Date: 5/31/2024 |