|
Download Data (XLS File) |
|
||||||||
|
||||||||
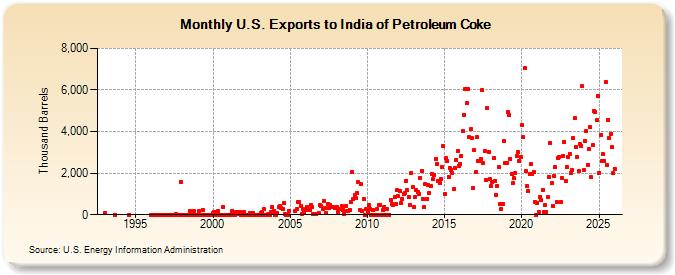
| U.S. Exports to India of Petroleum Coke (Thousand Barrels) | ||||||||
| Year | Jan | Feb | Mar | Apr | May | Jun | Jul | Aug | Sep | Oct | Nov | Dec |
|---|---|---|---|---|---|---|---|---|---|---|---|---|
| 1993 | 84 | 0 | ||||||||||
| 1994 | 0 | |||||||||||
| 1996 | 0 | 0 | 0 | 0 | 0 | 0 | 0 | 0 | 0 | 0 | 2 | 0 |
| 1997 | 0 | 0 | 2 | 0 | 0 | 2 | 0 | 11 | 0 | 0 | 0 | 1,593 |
| 1998 | 0 | 0 | 2 | 0 | 0 | 2 | 197 | 2 | 0 | 192 | 2 | 0 |
| 1999 | 2 | 165 | 0 | 2 | 227 | 0 | 2 | 2 | 0 | 4 | 0 | 2 |
| 2000 | 73 | 146 | 2 | 8 | 164 | 0 | 0 | 0 | 395 | 0 | 0 | 2 |
| 2001 | 0 | 8 | 6 | 200 | 17 | 0 | 148 | 151 | 42 | 141 | 4 | 35 |
| 2002 | 144 | 8 | 0 | 4 | 0 | 99 | 0 | 88 | 0 | 0 | 0 | 0 |
| 2003 | 0 | 93 | 130 | 0 | 254 | 0 | 0 | 55 | 0 | 110 | 369 | 182 |
| 2004 | 0 | 0 | 82 | 375 | 401 | 315 | 263 | 540 | 19 | 0 | 0 | 184 |
| 2005 | 181 | 254 | 631 | 591 | 424 | 44 | 279 | 149 | ||||
| 2006 | 230 | 362 | 270 | 248 | 465 | 364 | 37 | 51 | 17 | 73 | 470 | |
| 2007 | 438 | 284 | 661 | 307 | 64 | 493 | 301 | 490 | 363 | 392 | 300 | |
| 2008 | 393 | 149 | 263 | 398 | 248 | 44 | 428 | 179 | 167 | 243 | 616 | |
| 2009 | 2,064 | 734 | 955 | 780 | 1,026 | 1,557 | 234 | 1,461 | 191 | 738 | 0 | 267 |
| 2010 | 138 | 465 | 272 | 0 | 243 | 5 | 0 | 274 | 0 | 489 | 485 | 4 |
| 2011 | 243 | 385 | 0 | 273 | 1 | 0 | 720 | 516 | 475 | 845 | 500 | 1,174 |
| 2012 | 899 | 1,126 | 549 | 763 | 974 | 1,050 | 1,644 | 1,174 | 837 | 488 | 2,001 | 1,311 |
| 2013 | 357 | 864 | 1,168 | 1,115 | 1,005 | 1,784 | 2,116 | 776 | 363 | 1,471 | 765 | 1,421 |
| 2014 | 1,044 | 1,378 | 1,962 | 1,694 | 1,913 | 2,699 | 2,450 | 1,605 | 1,505 | 1,735 | 2,278 | 3,284 |
| 2015 | 1,005 | 2,707 | 2,589 | 1,805 | 2,255 | 2,160 | 2,004 | 1,234 | 2,252 | 2,646 | 3,064 | 2,360 |
| 2016 | 2,452 | 2,841 | 4,030 | 4,802 | 6,042 | 5,354 | 6,063 | 3,725 | 4,103 | 3,696 | 1,285 | 3,092 |
| 2017 | 2,073 | 3,720 | 2,572 | 2,565 | 2,668 | 5,989 | 2,468 | 3,068 | 1,675 | 5,134 | 3,021 | 1,727 |
| 2018 | 1,367 | 1,569 | 2,710 | 1,630 | 966 | 1,403 | 2,307 | 495 | 281 | 530 | 3,535 | 2,469 |
| 2019 | 2,468 | 4,917 | 4,802 | 2,680 | 1,980 | 1,509 | 1,744 | 2,003 | 2,817 | 3,004 | 2,601 | 2,768 |
| 2020 | 4,319 | 3,733 | 7,049 | 2,087 | 1,384 | 1,131 | 1,955 | 2,446 | 1,980 | 2,051 | 628 | 0 |
| 2021 | 582 | 150 | 871 | 685 | 1,180 | 149 | 468 | 151 | 833 | 1,814 | 3,453 | 1,506 |
| 2022 | 435 | 1,855 | 2,300 | 595 | 2,704 | 2,780 | 588 | 1,788 | 2,827 | 3,517 | 1,608 | 2,274 |
| 2023 | 2,762 | 2,931 | 2,004 | 2,391 | 3,038 | 4,604 | 3,253 | 2,753 | 2,134 | 3,380 | 3,300 | 6,171 |
| 2024 | 2,297 | |||||||||||
| - = No Data Reported; -- = Not Applicable; NA = Not Available; W = Withheld to avoid disclosure of individual company data. |
| Release Date: 3/29/2024 |
| Next Release Date: 4/30/2024 |