|
Download Data (XLS File) |
|
||||||||
|
||||||||
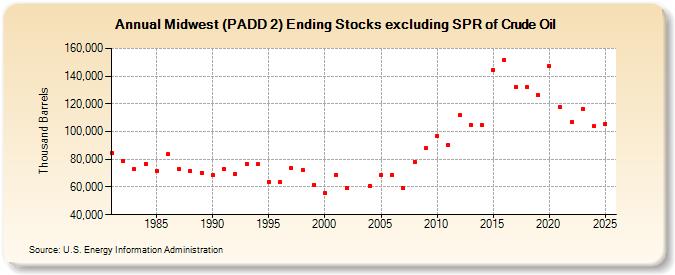
| Midwest (PADD 2) Ending Stocks excluding SPR of Crude Oil (Thousand Barrels) | ||||||||
| Decade | Year-0 | Year-1 | Year-2 | Year-3 | Year-4 | Year-5 | Year-6 | Year-7 | Year-8 | Year-9 |
|---|---|---|---|---|---|---|---|---|---|---|
| 1980's | 84,448 | 78,450 | 72,717 | 76,874 | 71,791 | 83,467 | 73,043 | 71,576 | 70,343 | |
| 1990's | 68,367 | 72,979 | 69,209 | 76,806 | 76,278 | 63,820 | 63,415 | 73,581 | 72,393 | 61,624 |
| 2000's | 55,359 | 68,935 | 59,572 | 60,910 | 68,611 | 68,526 | 59,039 | 78,375 | 87,868 | |
| 2010's | 96,793 | 90,455 | 111,592 | 104,988 | 104,555 | 144,504 | 151,751 | 132,031 | 132,102 | 126,547 |
| 2020's | 147,225 | 117,519 | 107,006 | 116,401 |
| - = No Data Reported; -- = Not Applicable; NA = Not Available; W = Withheld to avoid disclosure of individual company data. |
| Release Date: 3/29/2024 |
| Next Release Date: 8/30/2024 |