|
Download Data (XLS File) |
|
||||||||
|
||||||||
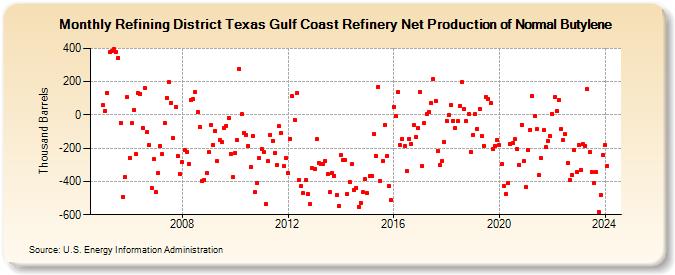
| Refining District Texas Gulf Coast Refinery Net Production of Normal Butylene (Thousand Barrels) | ||||||||
| Year | Jan | Feb | Mar | Apr | May | Jun | Jul | Aug | Sep | Oct | Nov | Dec |
|---|---|---|---|---|---|---|---|---|---|---|---|---|
| 2005 | 58 | 23 | 134 | 378 | 384 | 395 | 376 | 345 | -47 | -491 | -375 | 106 |
| 2006 | -258 | -51 | 31 | -235 | 133 | 128 | -76 | 162 | -102 | -182 | -437 | -268 |
| 2007 | -465 | -350 | -187 | -236 | -47 | 104 | 196 | 73 | -139 | 50 | -244 | -357 |
| 2008 | -285 | -211 | -220 | -295 | 91 | 94 | 137 | 19 | -73 | -397 | -390 | -352 |
| 2009 | -223 | -60 | -179 | -96 | -280 | -149 | -165 | -78 | -64 | -20 | -233 | -374 |
| 2010 | -230 | -150 | 277 | 3 | -108 | -118 | -186 | -314 | -126 | -465 | -407 | -260 |
| 2011 | -205 | -223 | -536 | -279 | -118 | -155 | -230 | -301 | -69 | -111 | -310 | -258 |
| 2012 | -348 | -142 | 112 | -32 | 131 | -391 | -428 | -472 | -393 | -474 | -538 | -320 |
| 2013 | -323 | -147 | -289 | -293 | -297 | -277 | -357 | -465 | -352 | -367 | -479 | -546 |
| 2014 | -243 | -269 | -273 | -475 | -402 | -296 | -452 | -437 | -552 | -527 | -466 | -388 |
| 2015 | -470 | -370 | -369 | -112 | -245 | 170 | -396 | -278 | -61 | -245 | -428 | -513 |
| 2016 | 50 | -7 | 139 | -183 | -144 | -187 | -339 | -142 | -175 | -63 | -131 | -81 |
| 2017 | 137 | -306 | -51 | 6 | 20 | 72 | 215 | 85 | -219 | -302 | -276 | -161 |
| 2018 | -35 | -1 | 59 | -35 | -77 | -39 | 53 | 197 | 37 | -39 | 7 | -222 |
| 2019 | -119 | 4 | -84 | 36 | -125 | -184 | 108 | 97 | 69 | -204 | -184 | -153 |
| 2020 | -183 | -297 | -426 | -474 | -409 | -176 | -169 | -147 | -206 | -300 | -59 | -279 |
| 2021 | -434 | -213 | -89 | 114 | -8 | -87 | -363 | -262 | -92 | -195 | -155 | -127 |
| 2022 | 5 | 106 | 23 | 89 | -86 | -150 | -117 | -290 | -392 | -359 | -208 | -345 |
| 2023 | -180 | -331 | -176 | -185 | 154 | -220 | -344 | -412 | -344 | -583 | -481 | -240 |
| 2024 | -181 | |||||||||||
| - = No Data Reported; -- = Not Applicable; NA = Not Available; W = Withheld to avoid disclosure of individual company data. |
| Release Date: 3/29/2024 |
| Next Release Date: 4/30/2024 |