|
Download Data (XLS File) |
|
||||||||
|
||||||||
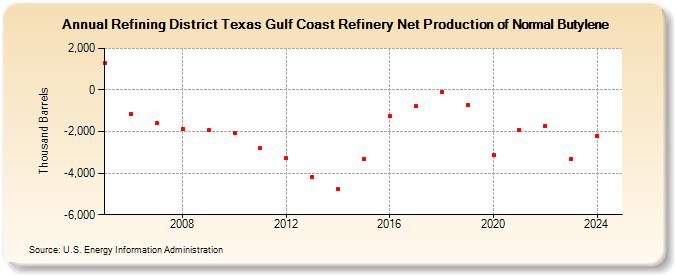
| Refining District Texas Gulf Coast Refinery Net Production of Normal Butylene (Thousand Barrels) | ||||||||
| Decade | Year-0 | Year-1 | Year-2 | Year-3 | Year-4 | Year-5 | Year-6 | Year-7 | Year-8 | Year-9 |
|---|---|---|---|---|---|---|---|---|---|---|
| 2000's | 1,286 | -1,155 | -1,602 | -1,882 | -1,921 | |||||
| 2010's | -2,084 | -2,795 | -3,295 | -4,192 | -4,780 | -3,317 | -1,263 | -780 | -95 | -739 |
| 2020's | -3,125 | -1,911 | -1,724 | -3,342 |
| - = No Data Reported; -- = Not Applicable; NA = Not Available; W = Withheld to avoid disclosure of individual company data. |
| Release Date: 3/29/2024 |
| Next Release Date: 8/30/2024 |