|
Download Data (XLS File) |
|
||||||||
|
||||||||
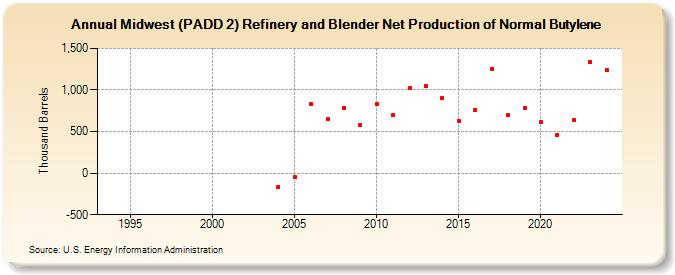
| Midwest (PADD 2) Refinery and Blender Net Production of Normal Butylene (Thousand Barrels) | ||||||||
| Decade | Year-0 | Year-1 | Year-2 | Year-3 | Year-4 | Year-5 | Year-6 | Year-7 | Year-8 | Year-9 |
|---|---|---|---|---|---|---|---|---|---|---|
| 1990's | W | W | W | W | W | W | W | |||
| 2000's | W | W | W | W | -162 | -51 | 831 | 646 | 785 | 579 |
| 2010's | 837 | 694 | 1,018 | 1,051 | 906 | 628 | 757 | 1,256 | 698 | 785 |
| 2020's | 610 | 458 | 634 | 1,338 |
| - = No Data Reported; -- = Not Applicable; NA = Not Available; W = Withheld to avoid disclosure of individual company data. |
| Release Date: 3/29/2024 |
| Next Release Date: 8/30/2024 |