|
Download Data (XLS File) |
|
||||||||
|
||||||||
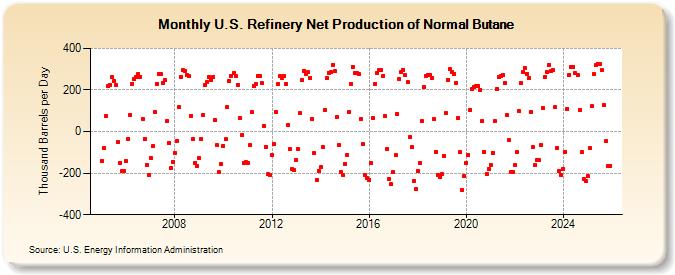
| U.S. Refinery Net Production of Normal Butane (Thousand Barrels per Day) | ||||||||
| Year | Jan | Feb | Mar | Apr | May | Jun | Jul | Aug | Sep | Oct | Nov | Dec |
|---|---|---|---|---|---|---|---|---|---|---|---|---|
| 2005 | -140 | -80 | 74 | 218 | 225 | 261 | 245 | 225 | -50 | -151 | -191 | -189 |
| 2006 | -141 | -34 | 82 | 230 | 251 | 264 | 278 | 264 | 61 | -37 | -159 | -207 |
| 2007 | -127 | -70 | 95 | 231 | 276 | 275 | 235 | 247 | 49 | -53 | -176 | -148 |
| 2008 | -103 | -44 | 118 | 263 | 294 | 292 | 273 | 266 | 76 | -38 | -151 | -166 |
| 2009 | -116 | -31 | 85 | 218 | 245 | 257 | 251 | 265 | 61 | -64 | -186 | -143 |
| 2010 | -69 | -38 | 118 | 241 | 269 | 282 | 268 | 226 | 64 | -18 | -149 | -148 |
| 2011 | -149 | -67 | 92 | 218 | 231 | 266 | 267 | 232 | 25 | -73 | -206 | -211 |
| 2012 | -115 | -60 | 95 | 230 | 265 | 257 | 268 | 231 | 30 | -86 | -181 | -186 |
| 2013 | -137 | -84 | 88 | 248 | 291 | 275 | 285 | 259 | 58 | -105 | -231 | -188 |
| 2014 | -171 | -72 | 103 | 258 | 284 | 285 | 322 | 289 | 69 | -67 | -194 | -208 |
| 2015 | -157 | -111 | 93 | 230 | 312 | 284 | 281 | 276 | 62 | -62 | -208 | -225 |
| 2016 | -232 | -151 | 63 | 231 | 282 | 297 | 296 | 269 | 73 | -83 | -227 | -254 |
| 2017 | -196 | -114 | 86 | 252 | 287 | 297 | 270 | 239 | -28 | -75 | -237 | -275 |
| 2018 | -189 | -149 | 49 | 212 | 269 | 274 | 273 | 259 | 60 | -96 | -209 | -219 |
| 2019 | -205 | -117 | 89 | 250 | 300 | 287 | 279 | 235 | 67 | -100 | -281 | -215 |
| 2020 | -152 | -111 | 106 | 206 | 216 | 219 | 218 | 202 | 50 | -96 | -205 | -180 |
| 2021 | -160 | -101 | 49 | 205 | 262 | 268 | 274 | 234 | 80 | -42 | -194 | -195 |
| 2022 | -163 | -100 | 97 | 233 | 286 | 307 | 279 | 258 | 95 | -76 | -163 | -138 |
| 2023 | -139 | -66 | 111 | 263 | 285 | 321 | 292 | 295 | 116 | -77 | -189 | -209 |
| 2024 | -151 | |||||||||||
| - = No Data Reported; -- = Not Applicable; NA = Not Available; W = Withheld to avoid disclosure of individual company data. |
| Release Date: 3/29/2024 |
| Next Release Date: 4/30/2024 |
Referring Pages: