|
Download Data (XLS File) |
|
||||||||
|
||||||||
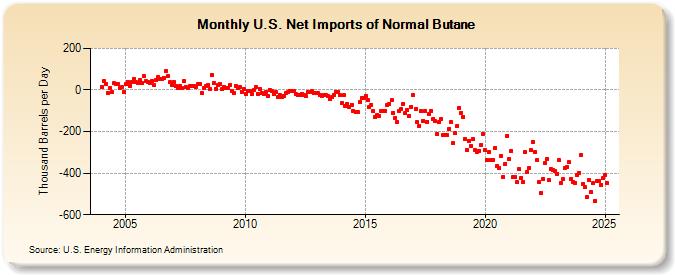
| U.S. Net Imports of Normal Butane (Thousand Barrels per Day) | ||||||||
| Year | Jan | Feb | Mar | Apr | May | Jun | Jul | Aug | Sep | Oct | Nov | Dec |
|---|---|---|---|---|---|---|---|---|---|---|---|---|
| 2004 | 15 | 41 | 30 | -13 | 10 | -8 | 32 | 30 | 31 | 11 | 16 | -9 |
| 2005 | 28 | 40 | 21 | 38 | 53 | 37 | 35 | 46 | 33 | 68 | 44 | 40 |
| 2006 | 33 | 44 | 23 | 47 | 60 | 53 | 52 | 59 | 91 | 65 | 36 | 22 |
| 2007 | 38 | 17 | 10 | 17 | 10 | 42 | 14 | 11 | 18 | 18 | 18 | 16 |
| 2008 | 28 | 28 | -13 | 10 | 17 | 22 | 7 | 73 | 35 | 7 | 22 | 29 |
| 2009 | 3 | 15 | 10 | 9 | 23 | -4 | -16 | 21 | 8 | 13 | -8 | 3 |
| 2010 | -18 | -7 | -6 | -21 | -1 | 13 | -17 | 6 | -13 | -18 | -12 | -27 |
| 2011 | 2 | -7 | -21 | -11 | -36 | -23 | -36 | -29 | -15 | -11 | -3 | -5 |
| 2012 | -6 | -19 | -26 | -24 | -19 | -22 | -30 | -12 | -9 | -7 | -16 | -13 |
| 2013 | -15 | -23 | -27 | -22 | -26 | -28 | -45 | -35 | -23 | -9 | -9 | -22 |
| 2014 | -64 | -26 | -78 | -66 | -81 | -71 | -99 | -106 | -107 | -58 | -38 | -40 |
| 2015 | -29 | -50 | -82 | -70 | -102 | -131 | -121 | -125 | -101 | -99 | -99 | -71 |
| 2016 | -66 | -50 | -110 | -133 | -154 | -101 | -90 | -66 | -112 | -98 | -125 | -80 |
| 2017 | -26 | -93 | -155 | -172 | -103 | -149 | -99 | -152 | -114 | -99 | -138 | -150 |
| 2018 | -214 | -152 | -139 | -217 | -218 | -217 | -186 | -155 | -256 | -209 | -173 | -85 |
| 2019 | -109 | -130 | -237 | -287 | -247 | -269 | -238 | -291 | -298 | -292 | -264 | -212 |
| 2020 | -288 | -335 | -297 | -335 | -337 | -277 | -365 | -377 | -317 | -419 | -356 | -220 |
| 2021 | -332 | -293 | -420 | -421 | -444 | -382 | -423 | -443 | -300 | -394 | -376 | -290 |
| 2022 | -251 | -298 | -338 | -443 | -496 | -429 | -351 | -331 | -435 | -381 | -384 | -392 |
| 2023 | -427 | -423 | -439 | -484 | -372 | -412 | -369 | -445 | -485 | -445 | -406 | -397 |
| 2024 | -311 | |||||||||||
| - = No Data Reported; -- = Not Applicable; NA = Not Available; W = Withheld to avoid disclosure of individual company data. |
| Release Date: 3/29/2024 |
| Next Release Date: 4/30/2024 |